View Sales And Stock (Inventory) Report
How to View the Sales and Stock Report in SwilERP
Reporting and analysis are essential to any business because they tell you exactly what's happening in your sales and stock. This report provides the performance of various sales activities and stock activities within a store.
Additionally, we will discuss exactly how to view reports of sales and stock In the SwilERP software. In this report, you can view the stock details, stock value, stock rate, current stock, current stock rate, etc. How you have to open the Sales And Stock report window inside the software is explained below:-
Start with Login in the SwilERP dashboard to initiate the process:
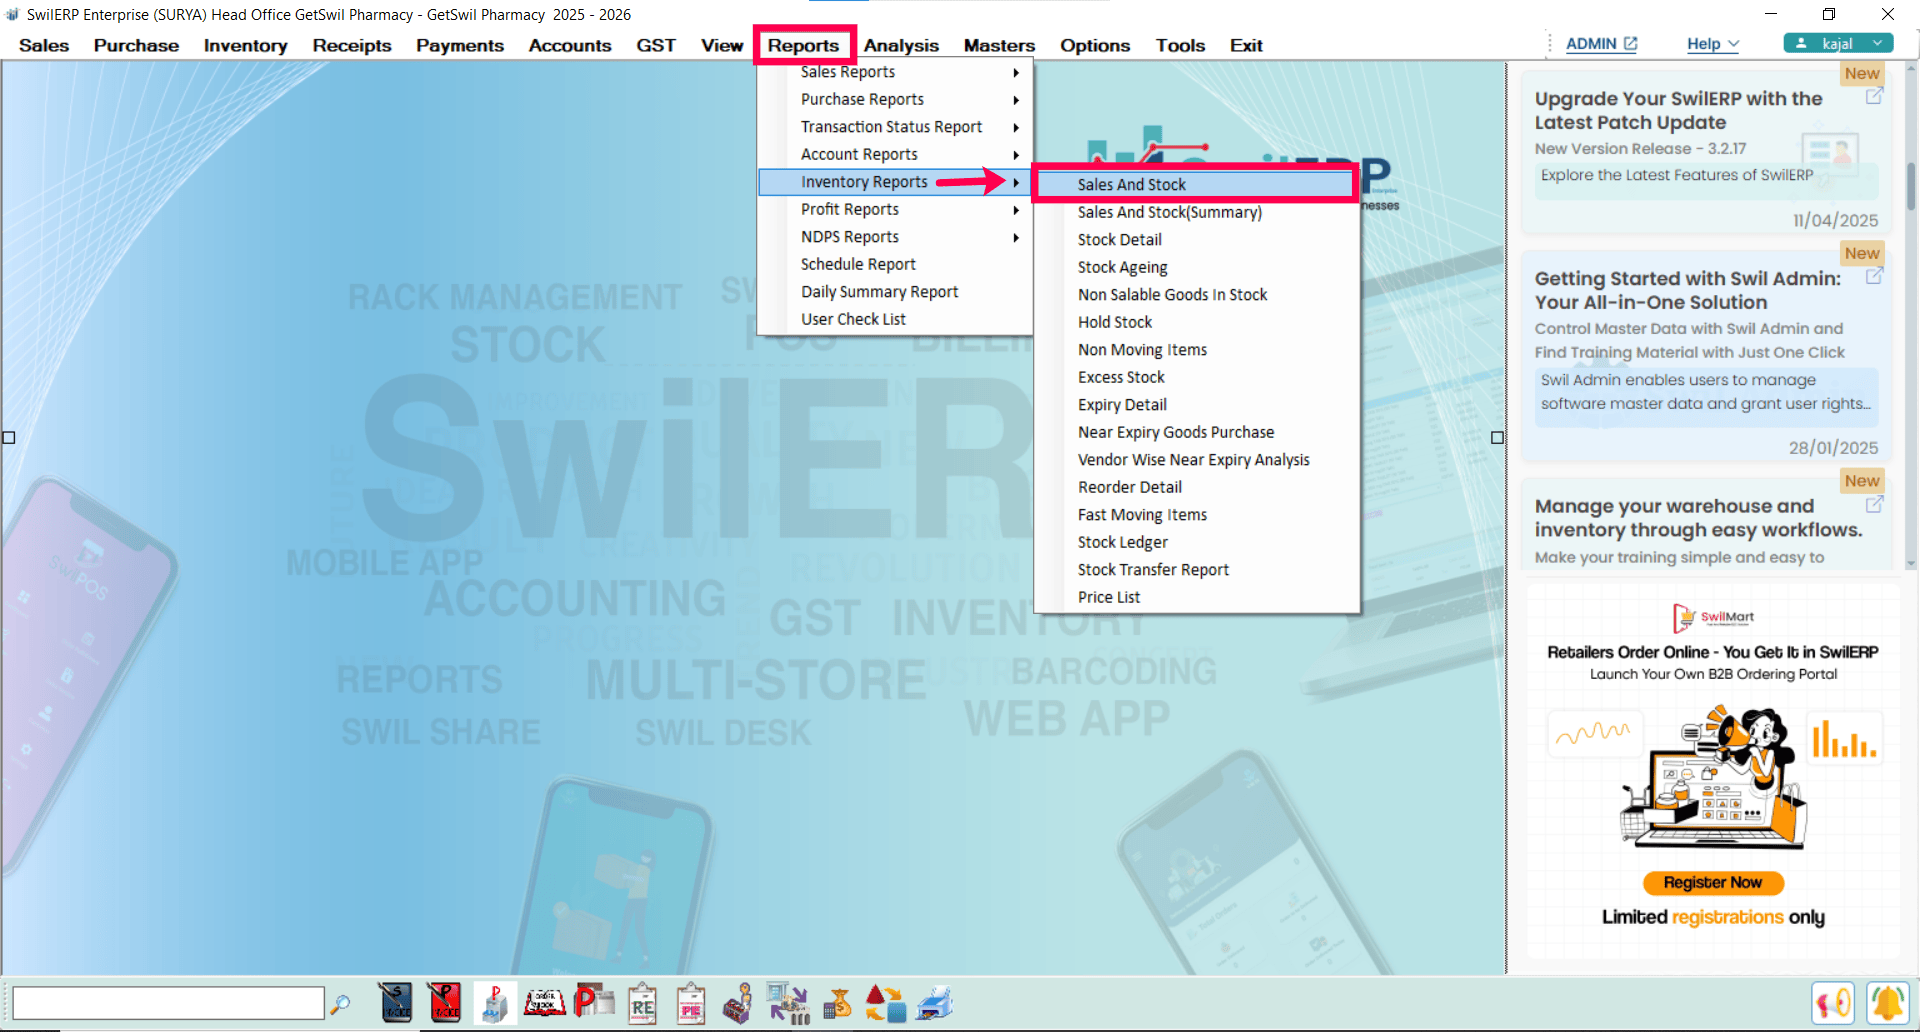
- Go to the Reports.
- Select the Inventory reports > Sales And Stock.
Reference windo
 SwilERP Dashboard Window
How to view the report:
- The next sales and stock window will open; now, you will see how to view the details.
- Go to the Home tab.
- Select the Date Range "From" to "To".
- Click on the Report Type and choose any option between Summary and Detail in which you want to view the report.
- If the users want to apply a filter to the data, they can do it from the Product and Manufacture tab.
- If required, set the Parameters.
- Click on the View tab.
Reference window: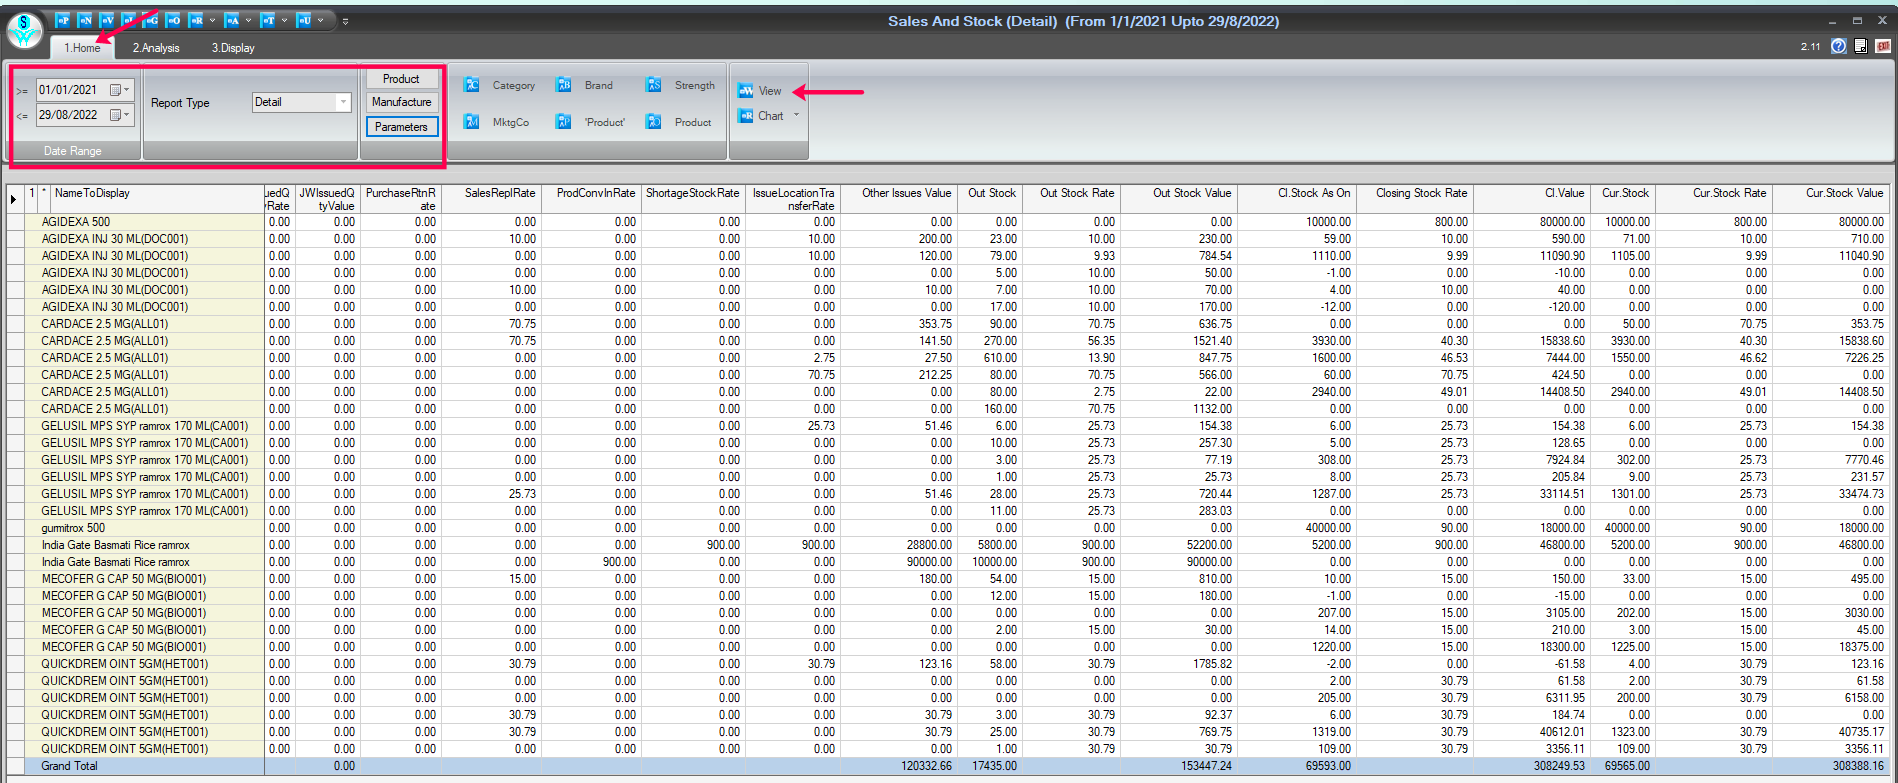
Report Window
How to select the options to view the report group-wise:
- As well as, if users want to view some other details in the report, then:-
- In-Home tab, select the below-given options:
- Category
- Brand
- Strength
- Marketing Company
- Product
- Now, click on the View tab.
Note:- Users can select all the above options as per the requirements.
Reference window: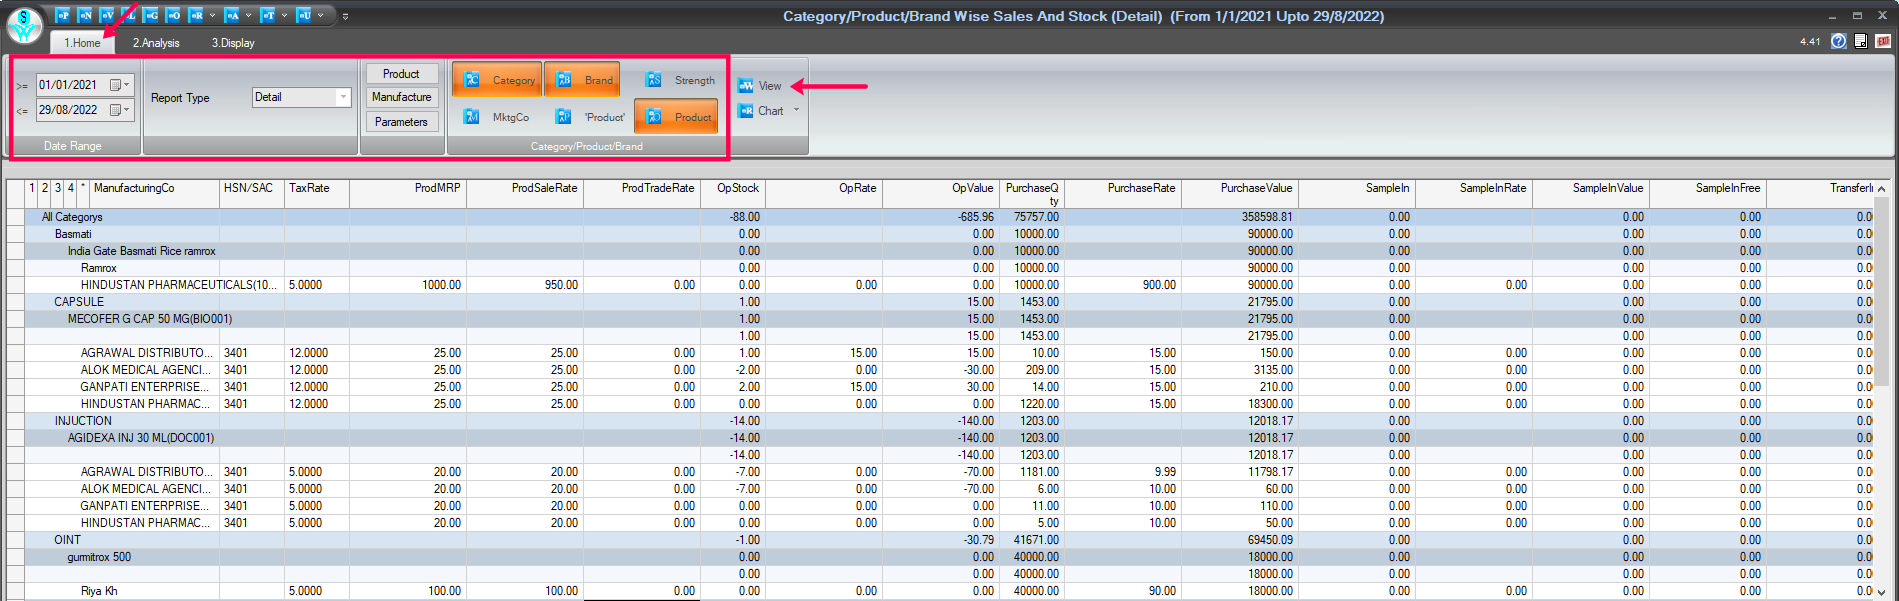
Report Window
How to convert data into chart form:
- Select the Home tab.
- Click on the Chart tab, and a report will be generated in Chart format.
Note: There will be many options inside the Chart tab, for example, Palette, Show Title, Show Gridlines, and Totals only. You can select any options as per the requirement.
Reference window: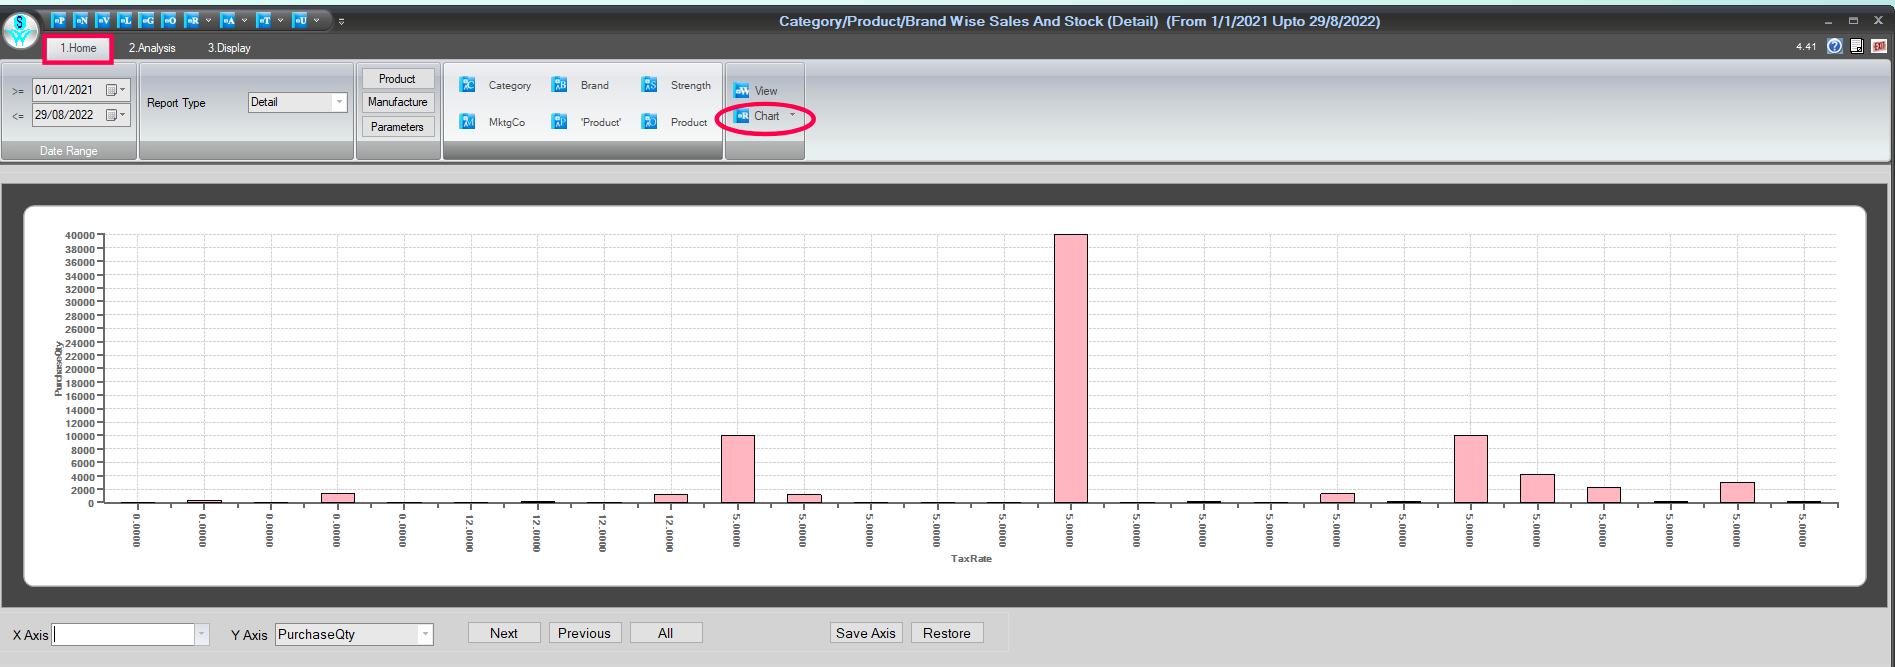
Chart Report Window
How to analyze the details:
- Go to the Analysis tab.
- Select the Date-Range from which you want to analyze the details.
- Click on the View tab.
- Use the field list to arrange fields in a Pivot Table.
- After choosing fields, you will see the data in Analysis Grid.
- Enter the name and click on the Save tab to save this report.
- If you want to open the previous report, enter that report name and click on the Open tab.
- Users can Remove/Export, and Import the report as their requirement.
- You can set Grid as per the requirement.
How to use the Areas Section:
Use the areas section (at the bottom) of the field list to rearrange fields the way you want by dragging them between the four areas.
Fields that you place in different areas are shown in the PivotTable as follows:
- Filters
- Columns
- Rows
- Values
Reference window: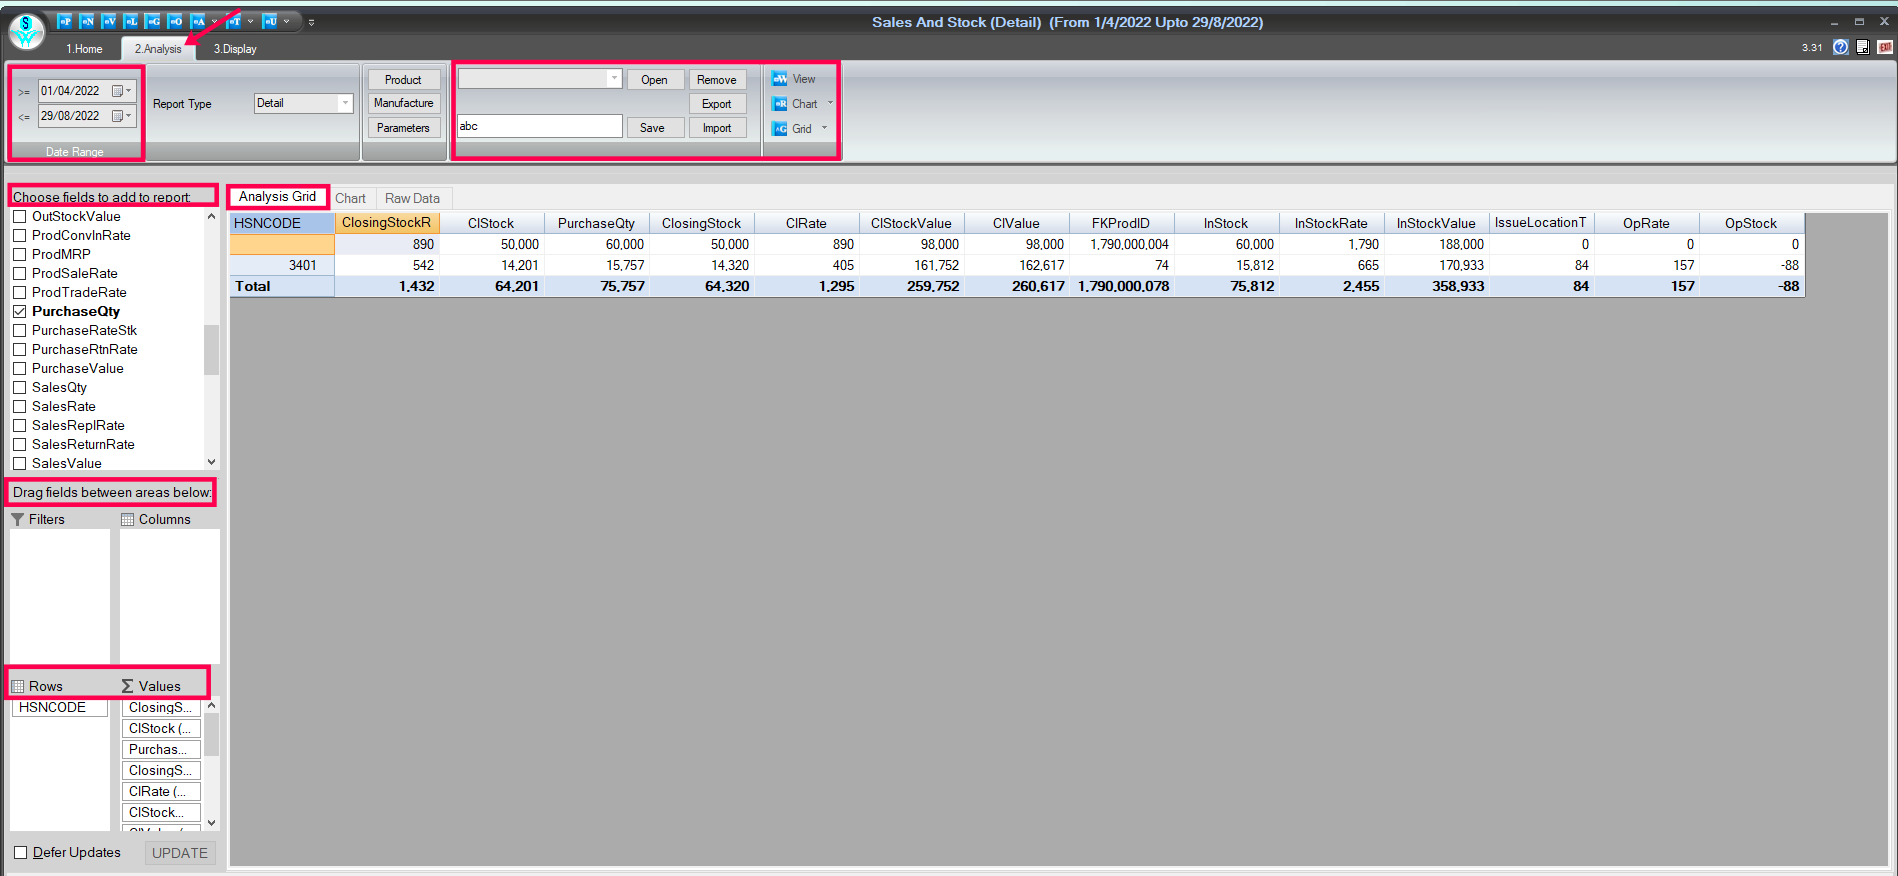
Analyze Report Window
How to view the Analysis data in chart form:
- After analyzing the data, if you want to view the details in the chart form, click on the given chart option.
Reference window: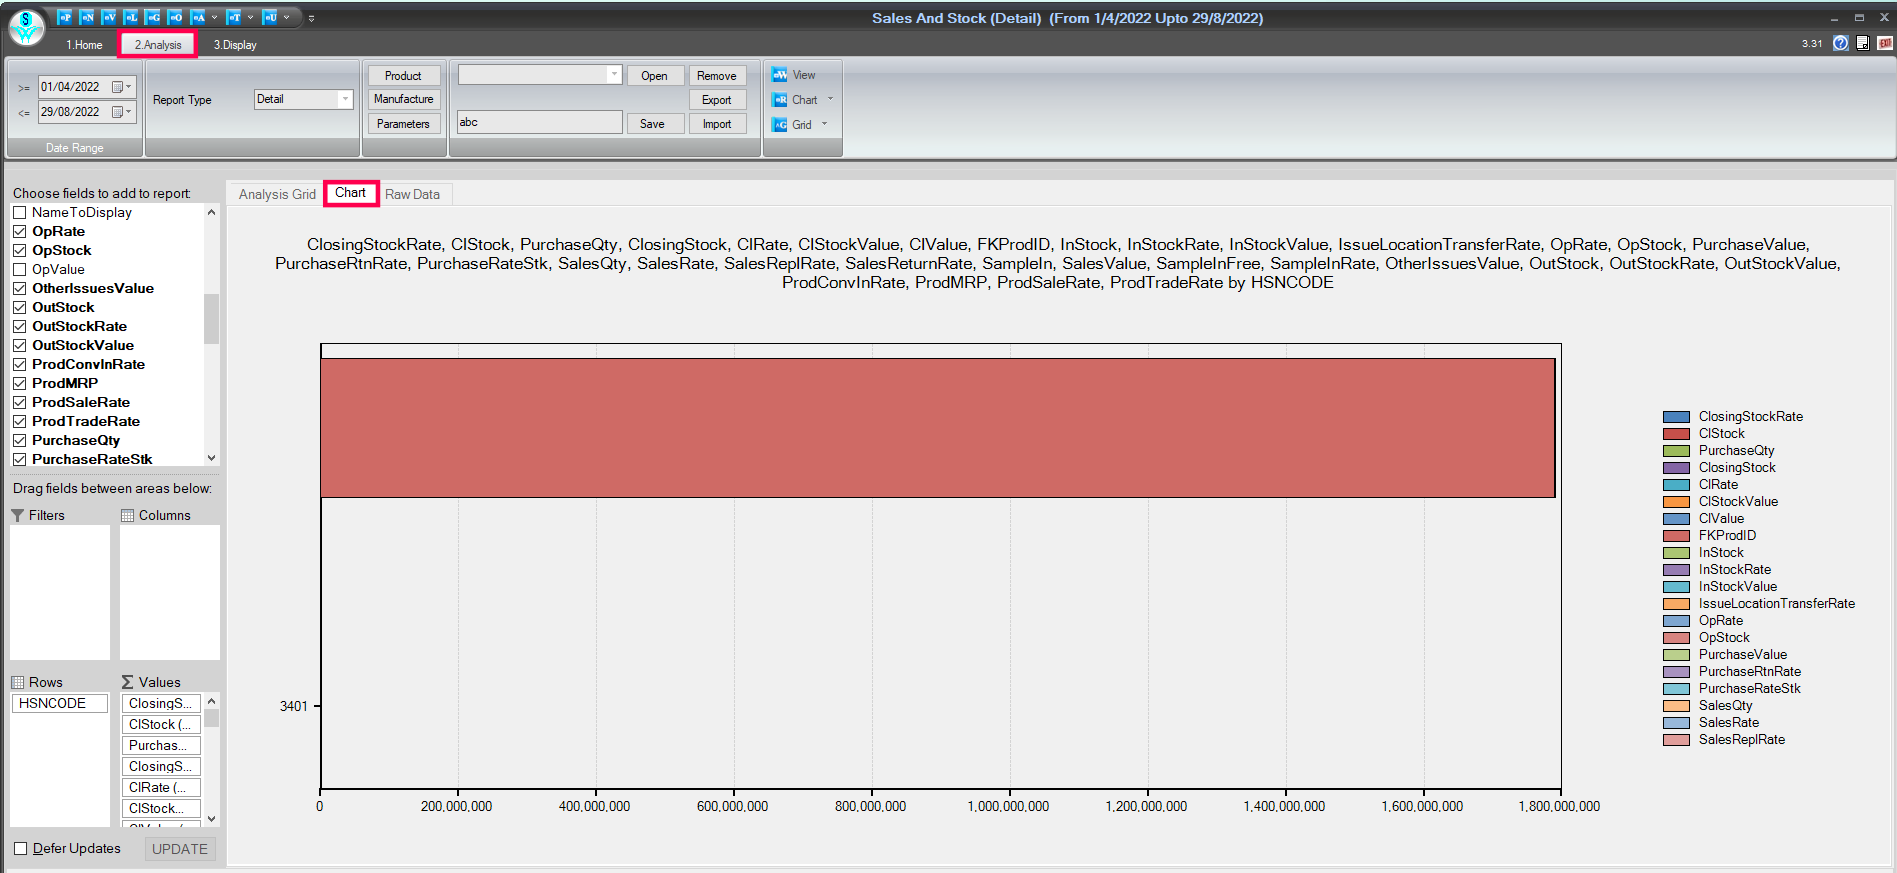
Chart Tab Window
How to view the Raw data:
- Click on the given 'Raw Data' option to view the Raw Data of sales and stock.
Reference window: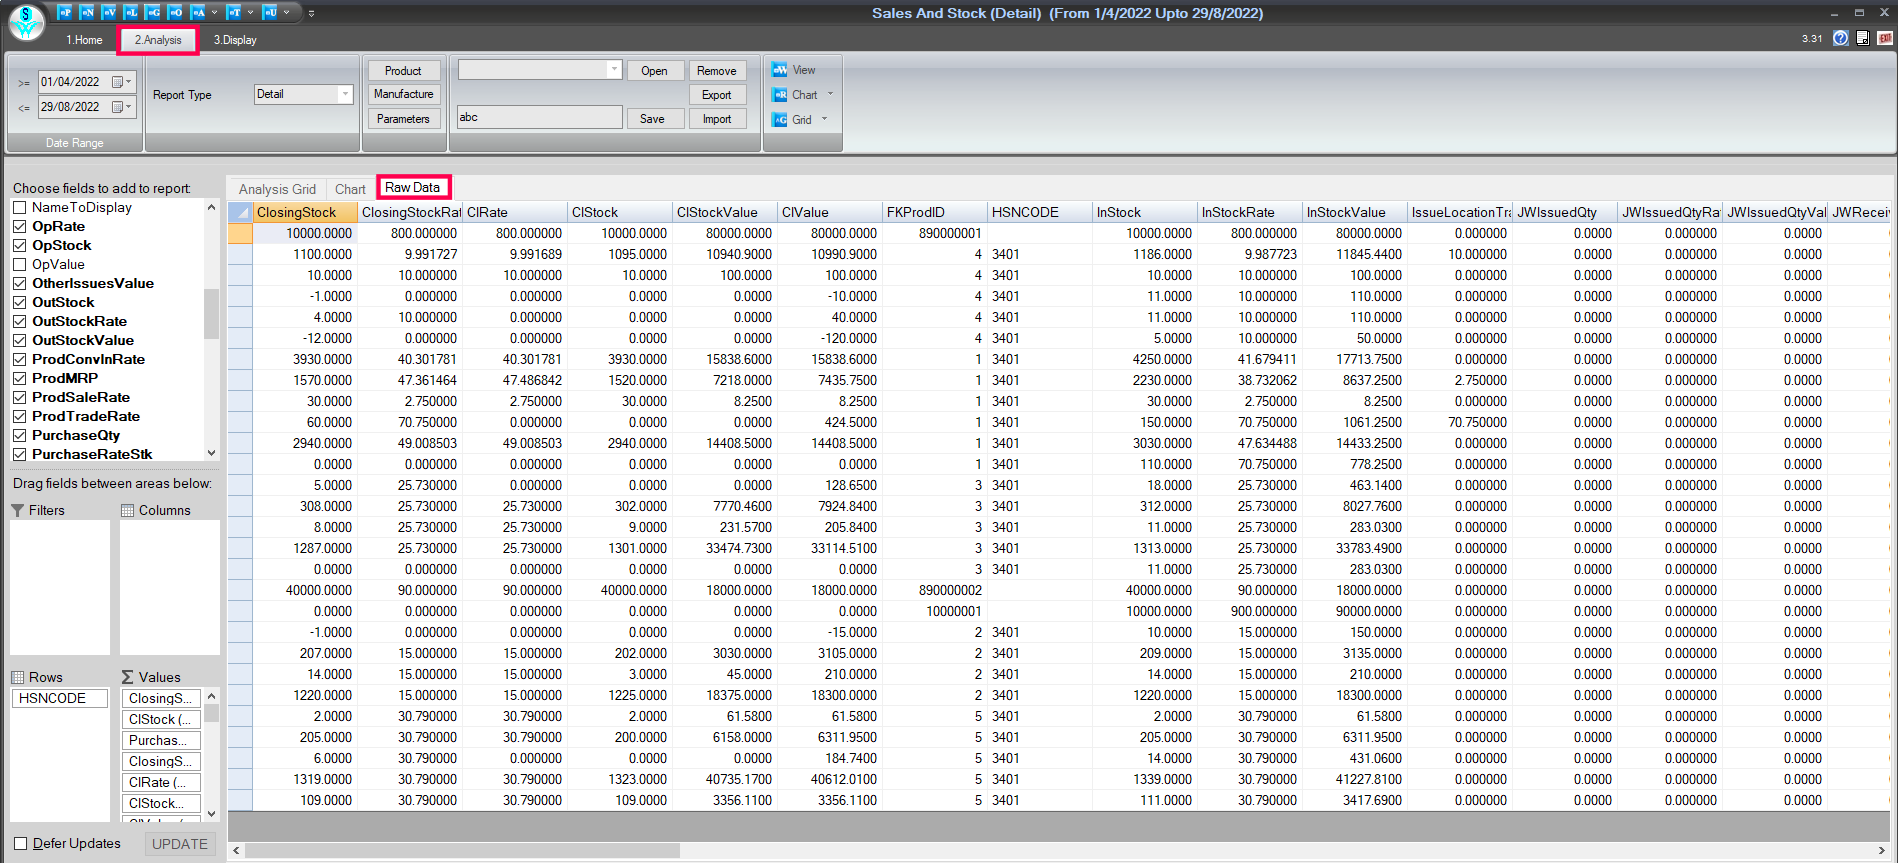
Analyze Report Window
How to take Print and Preview:
- Go to the Display tab.
- If the user wants to take the printout of this report, they can select the Print and Preview tab.
Reference window: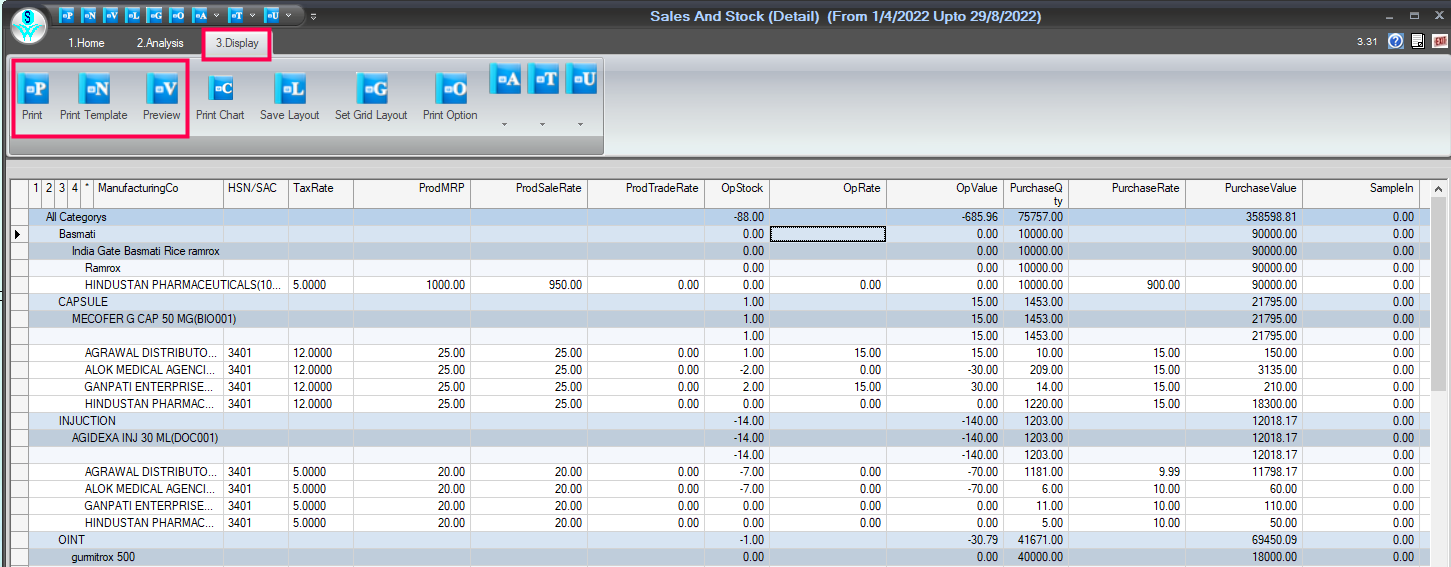
Print & Preview Tab Window
How to Export the report into excel and other formats:
- From the Display tab.
- Click on the 'T' point.
- Inside the 'T' point, there are given many export formats; select which format you want to export the report.
Reference window:
Export Options Tab Window

|


|
Related Articles
View Stock Detail Report
How to view the Stock Detail Report in SwilERP The stock report help in managing stock and tracking records of stock. It also assists in finding the purchase and sales numbers. A stock report is a detail of a vendor's existing stock. In the stock ...View Current Stock Profits Report
How to View the Current Stock Report in SwilERP Current stock means goods already on hand at the seller's premises at the purchase order time. In the Current Stock report, the product's category will be available. In the current stock profits report, ...Sales and Stock (Summary)
How to view Sales and Stock (Summary) Statement in SwilERP SwilERP offers detailed sales and stock reports, providing valuable insights into stock-related transactions. Users can access reports featuring columns such as Opening Stock, Purchase Value, ...Opening and Closing stock report
How to View Opening and Closing Stock Details in SwilERP The closing stock at the end of a month is the same as the opening stock at the beginning of the following month. In SwilERP Software, the user can view Opening and Closing Stock details under ...MIS Report View
How to view MIS Report Through SwilERP (RetailGraph) What is MIS View Report? MIS report stands for management information system. In the simplest terms, an MIS report does describe as a system that provides essential information for the management ...