View Adjustment Report
How to view Adjustment Report In SwilERP
The Inventory Adjustment report provides information about the adjustments you make to on-hand quantities of products and quantities, including the amount of the adjustment, and the remarks for the adjustment. In SwilERP Software, the user can easily view the Adjustment Report with adjusted details i.e. Shortage, Surplus, Net Amount, Net Quantity, etc. To view the Adjusted report, the user will follow the below steps.
Start with Login in the SwilERP dashboard to initiate the process:
- Go to the Report menu.
- Select Inventory Reports > Adjustment Report.
Reference Window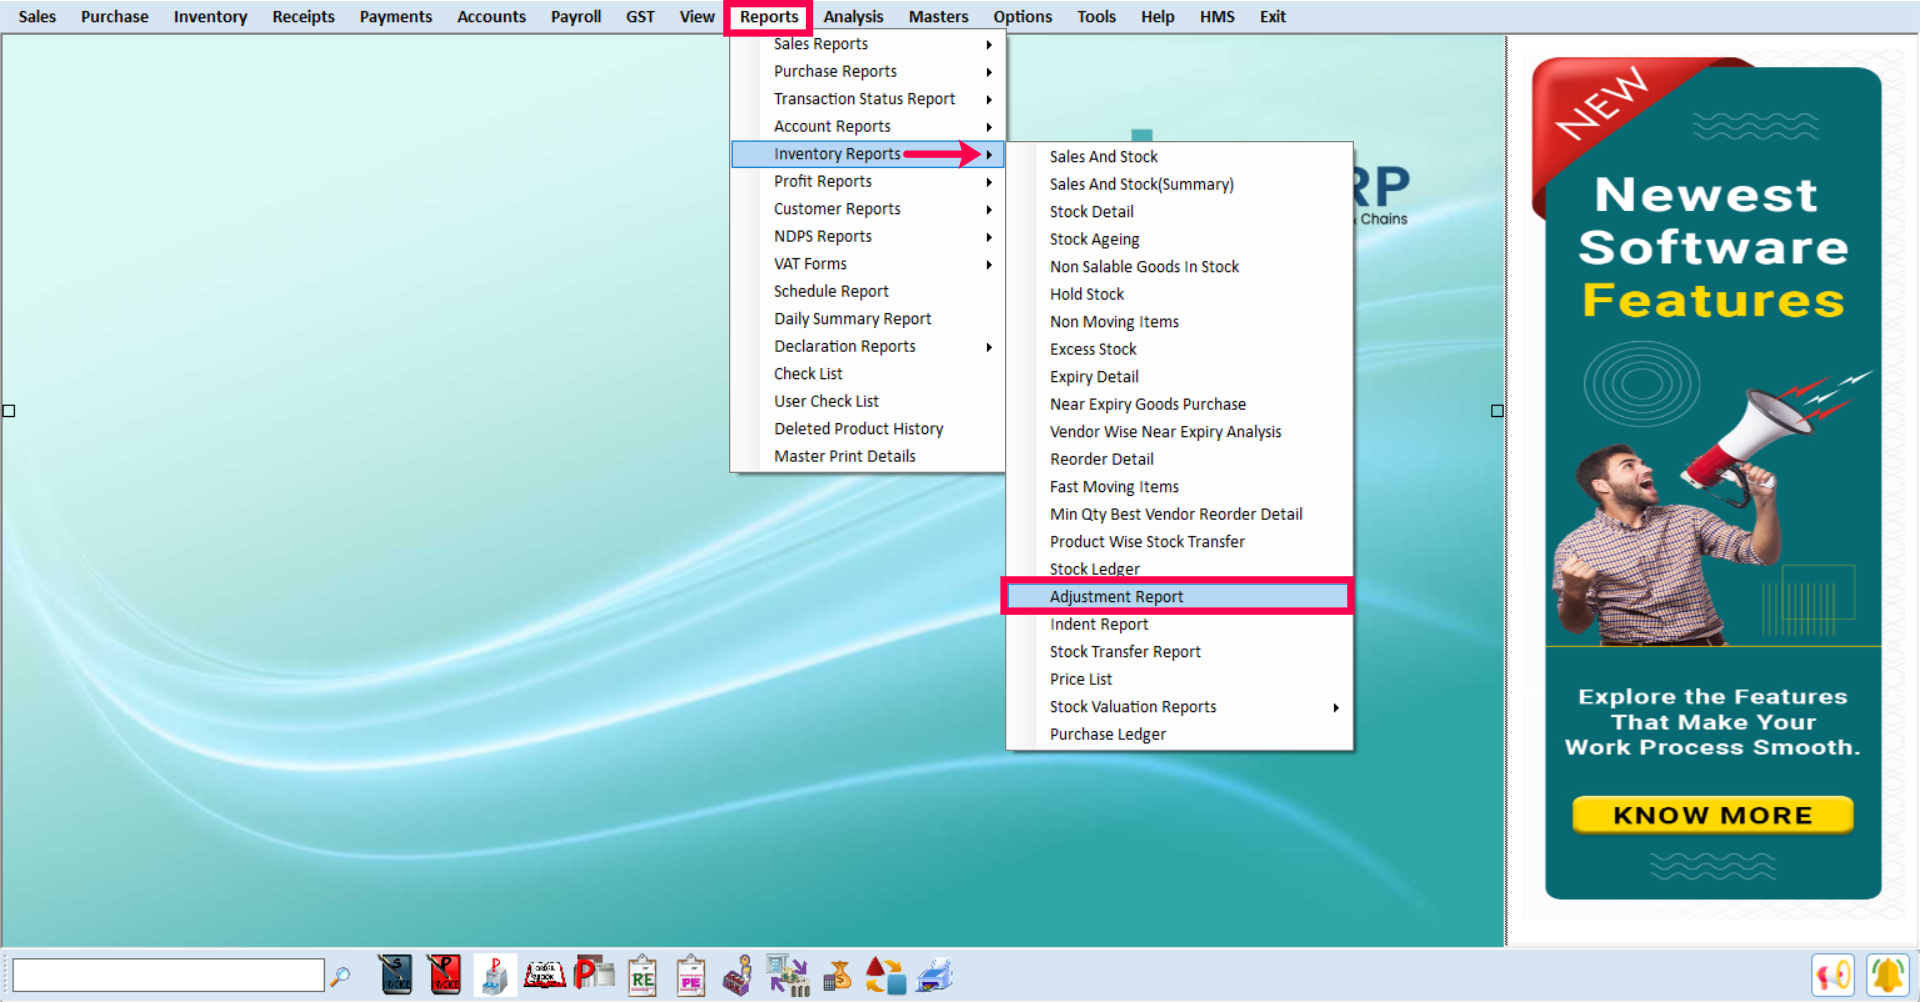
SwilERP Dashboard Window
How to set the parameters to view the report:
- Select the Report Type as in Summary or Details and data will show accordingly.
- If you want to apply the filter, select the Product tab and apply it.
- In the product tab you can select the Location also and details will show as per selected location.
Reference Window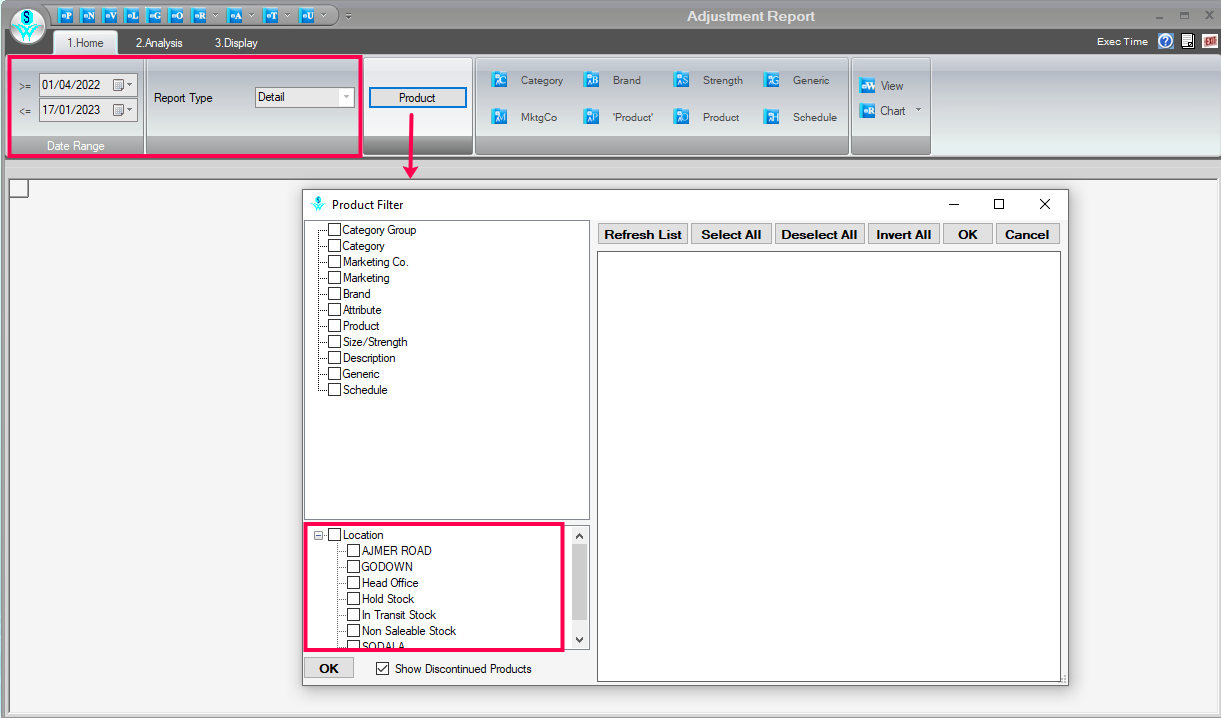
Set the Parameters Window
- Now click on the View tab and report will be generated.
Reference Window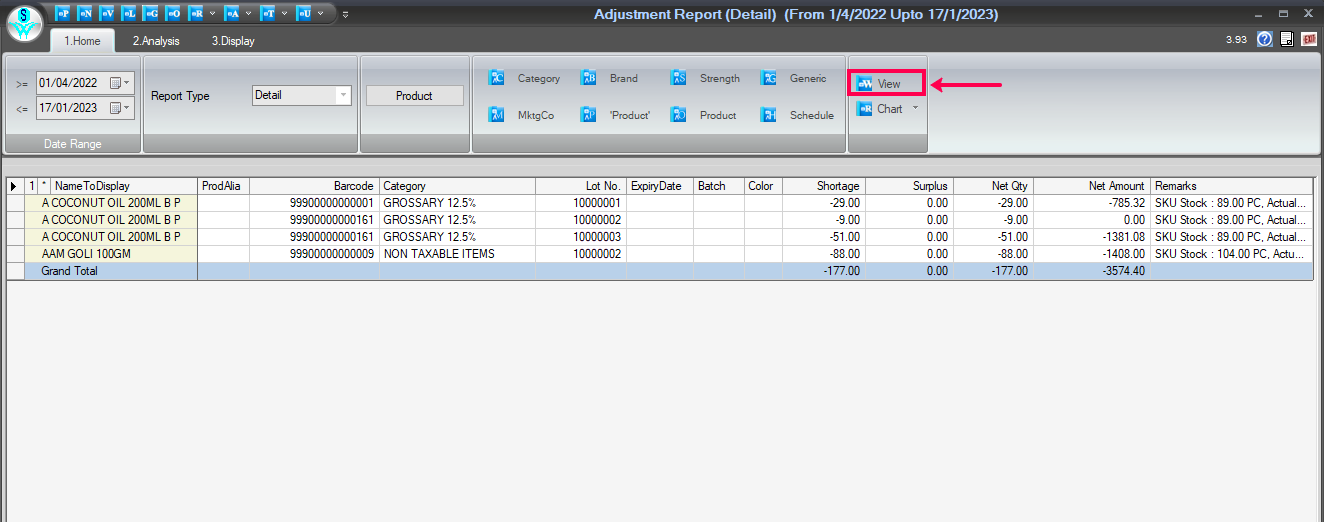
Report Details Window
- You can also view the details of the following options by selecting them:
- Category
- MktgCo.
- Brand
- 'Product'
- Strength
- Product
- Generic
- Schedule
- Click on the View option.
Reference Window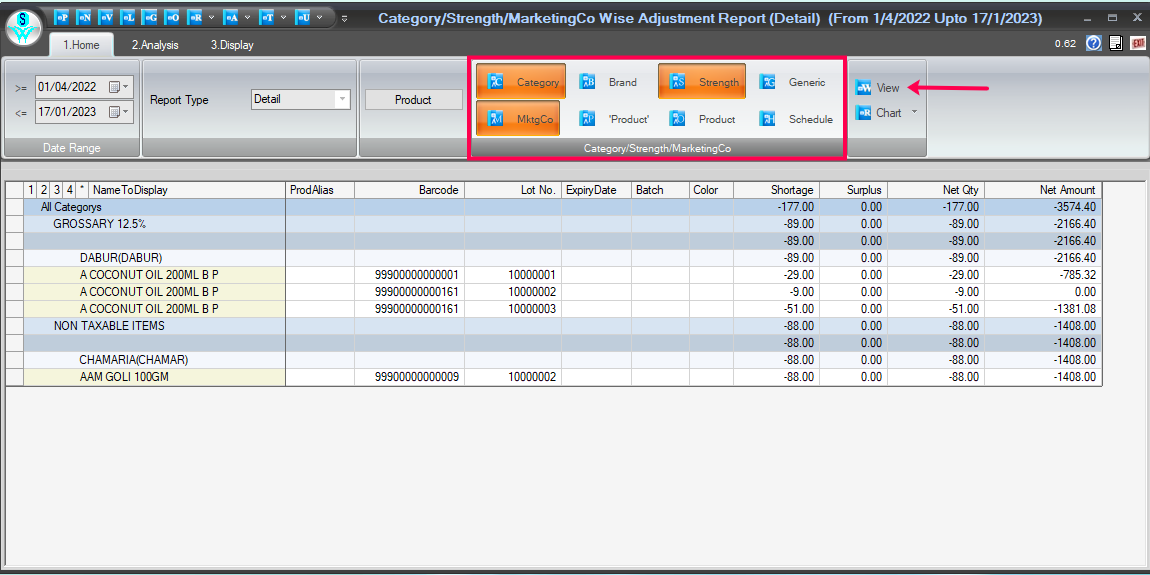
Report details with more options
How to convert data in chart form:
- From the Home tab.
- To convert report details into a chart format, click on the Chart tab.
- Inside the chart tab, there are given many chart options; select in which you want to convert the report.
Reference window: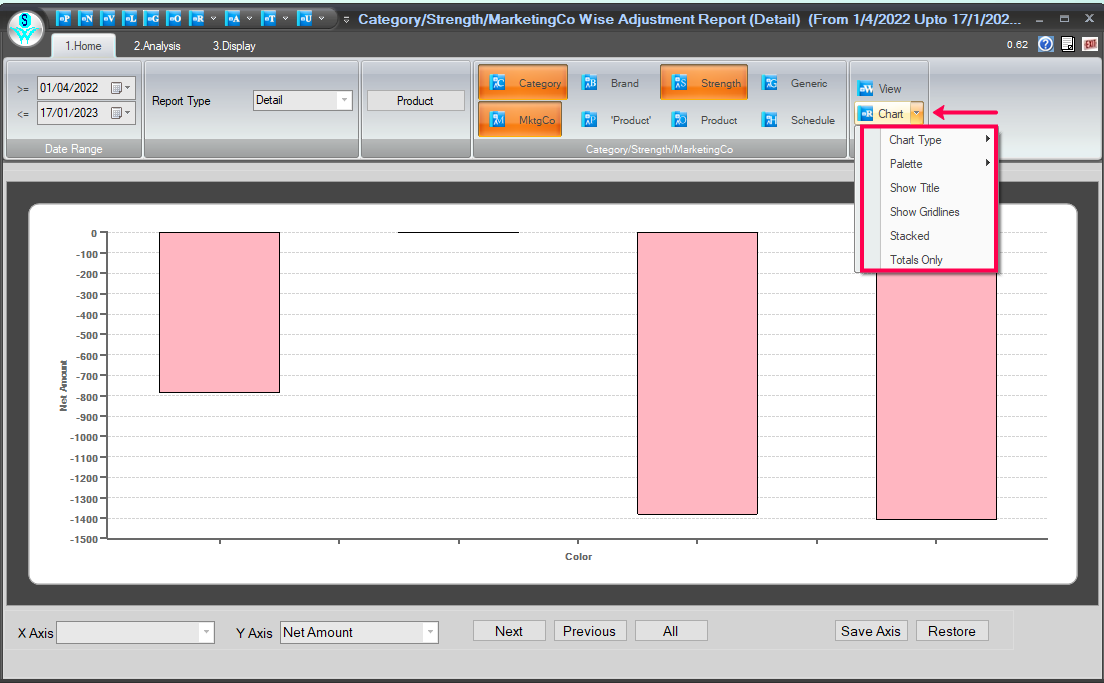
Chart Format Report Window
How to analyze the adjusted report details:
- Now, go to the Analysis tab.
- The second step is to click on the View tab. (you can change the date range here if you want)
- Use the field list to arrange fields in a Pivot Table.
- After choosing fields, you will see the selected fields data in Analysis Grid.
- Enter the report name and click on the Save tab to save this report.
- If you want to open the previous report, then enter that report name and click on the Open tab.
- Users can Remove/Export, and Import this report as their requirement.
- You can set Grid as per the requirement.
How to use the Areas Section:
- Use the areas section (at the bottom) of the field list to rearrange fields the way you want by dragging them between the four areas.
- Fields that you place in different areas are shown in the PivotTable as follows:
1. Filters2. Columns3. Rows4. Values
Reference window: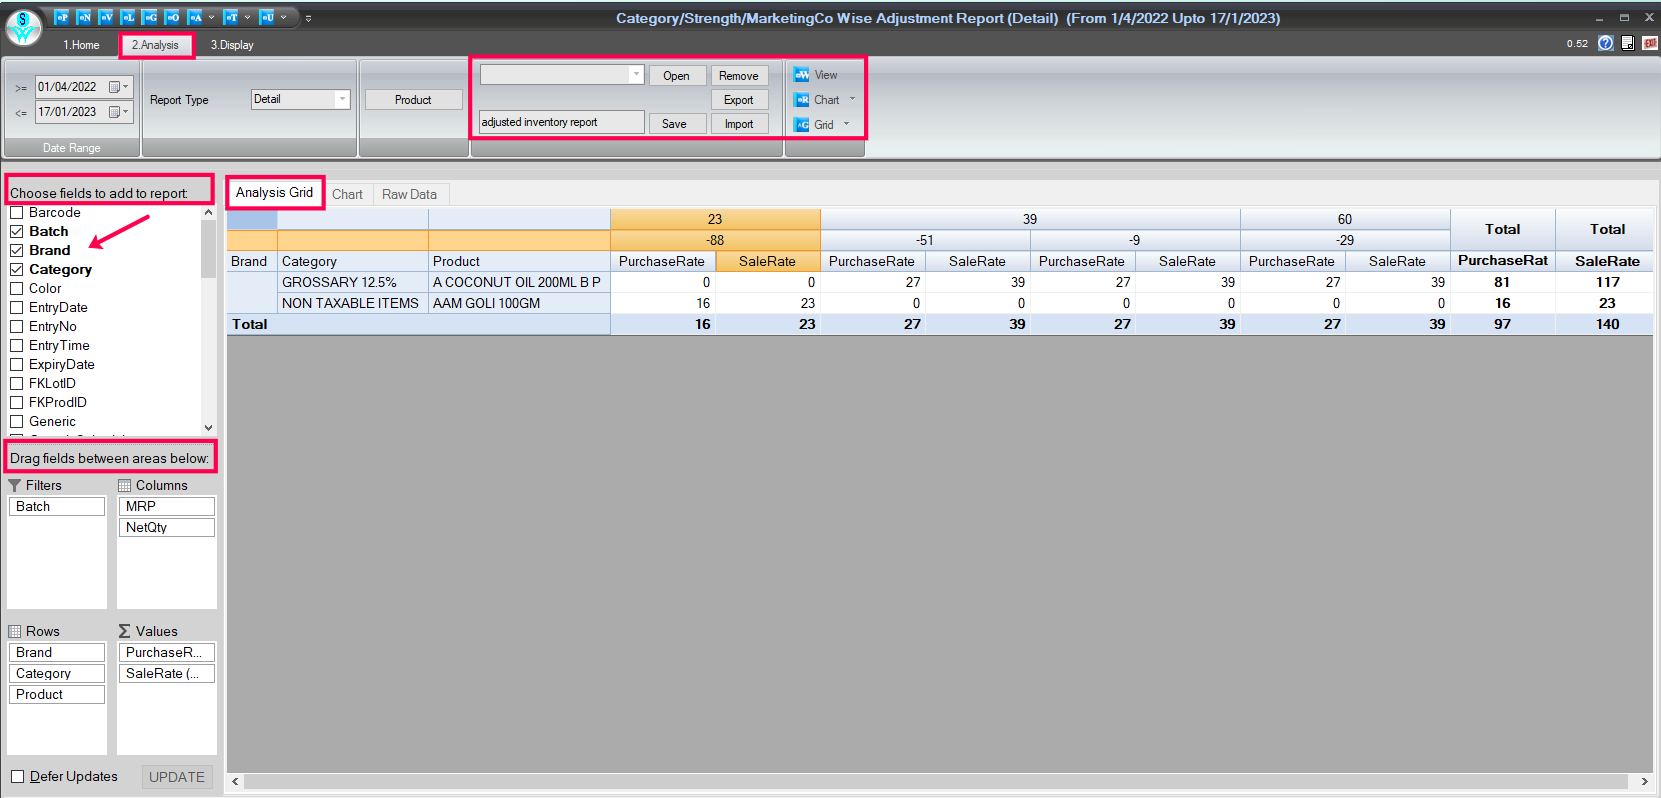
Analyze Report Data Window
You can view analytics data in chart form, for it click on the given Chart option and the report will look like the below given reference image.
Reference window: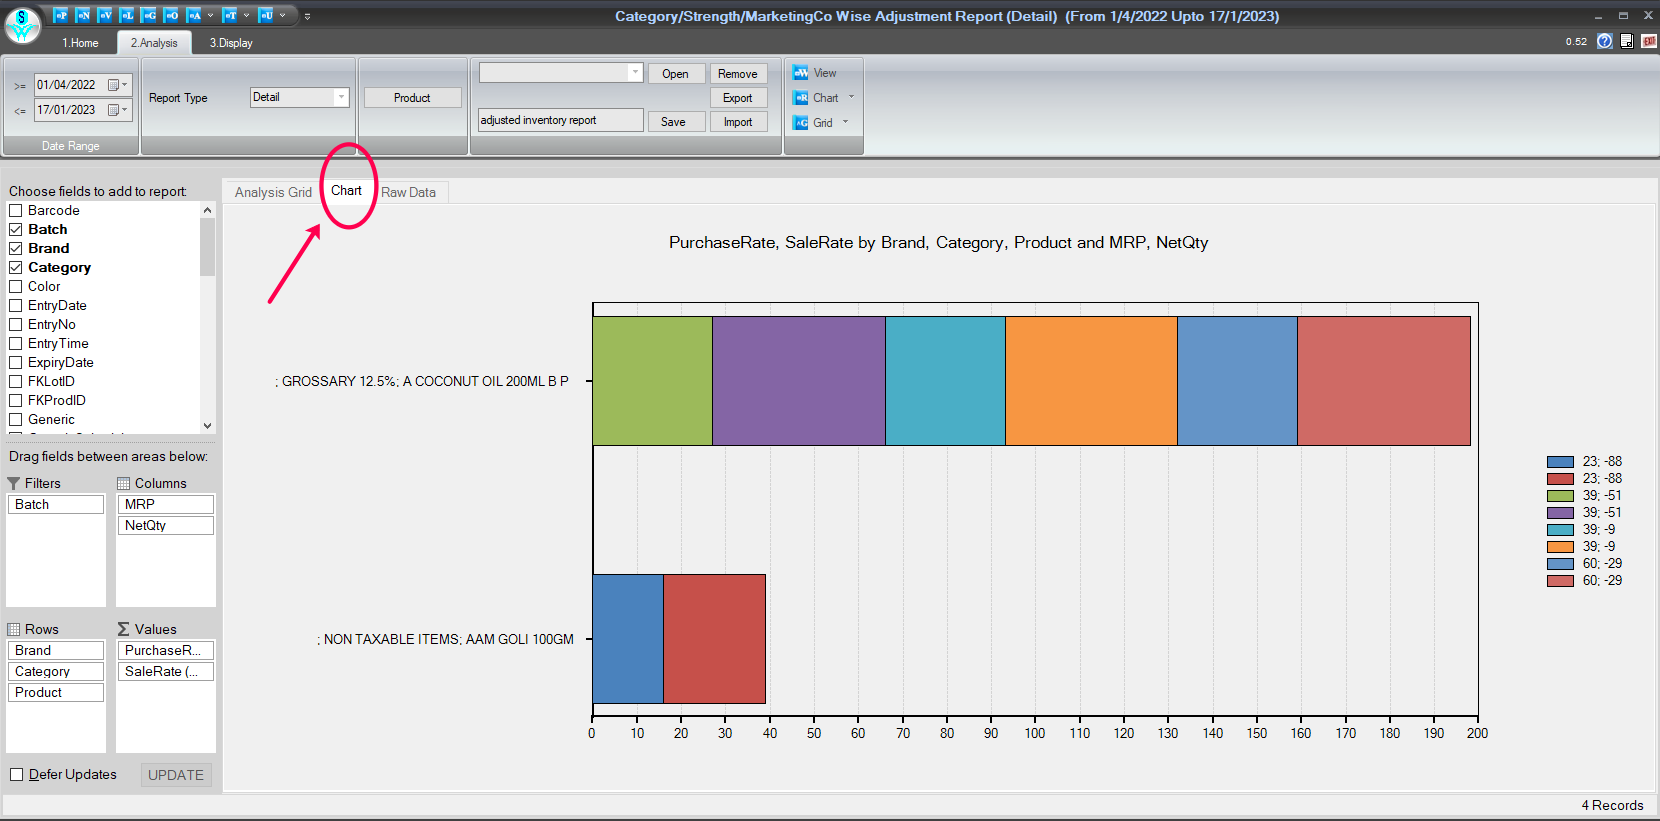
Chart Report Window
- Click on the given 'Raw Data' option to view the raw data of stock.
Reference window: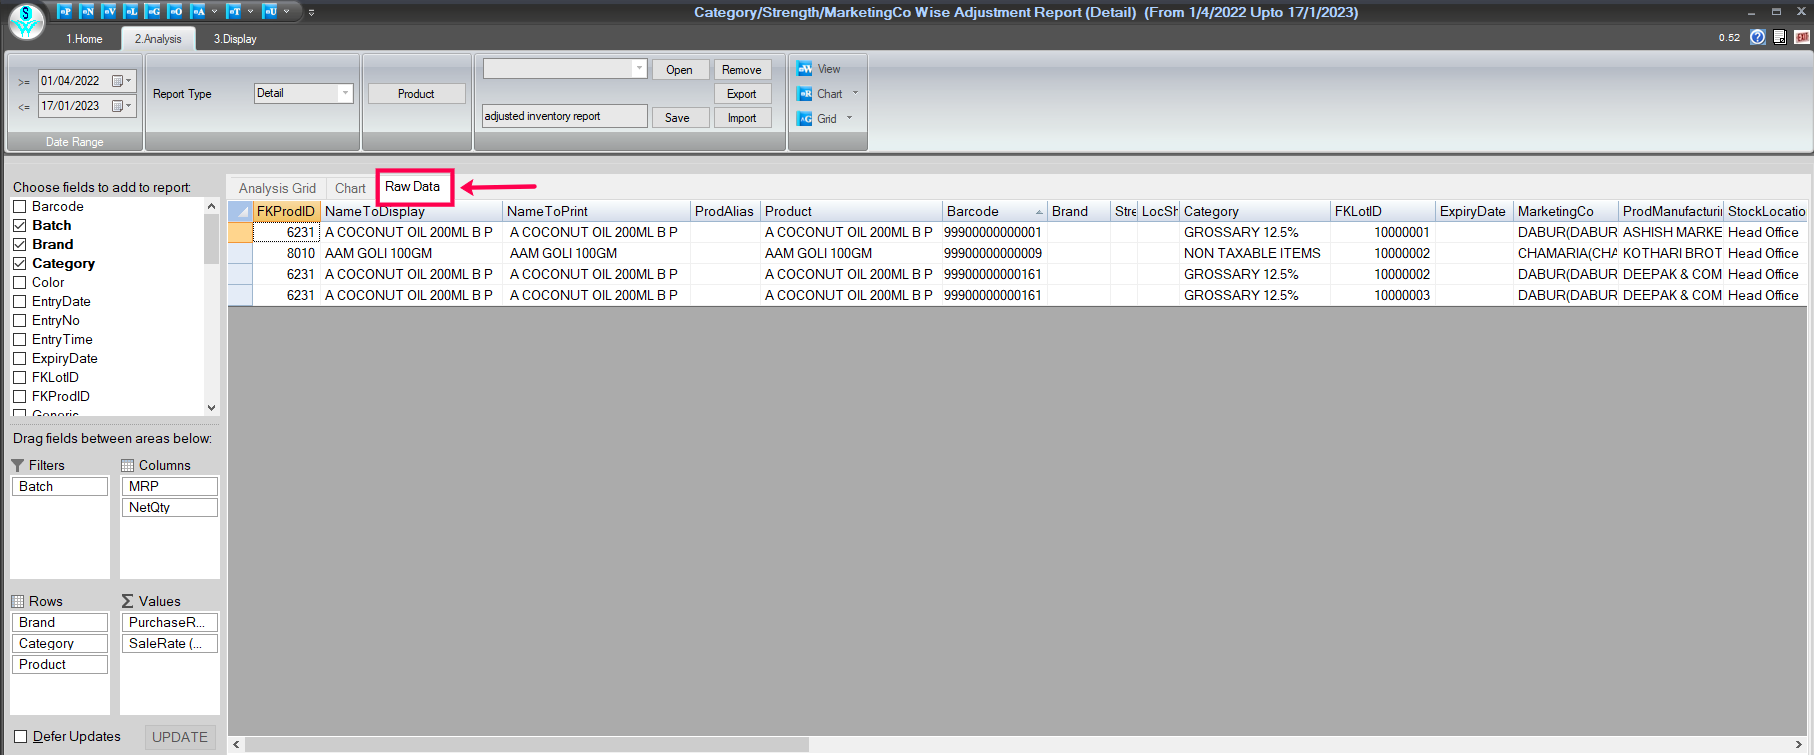
Raw details window
How to Print & Preview the Report:
- Go to the Display tab.
- To take the printout, click on the Print and Preview tab.
Reference window: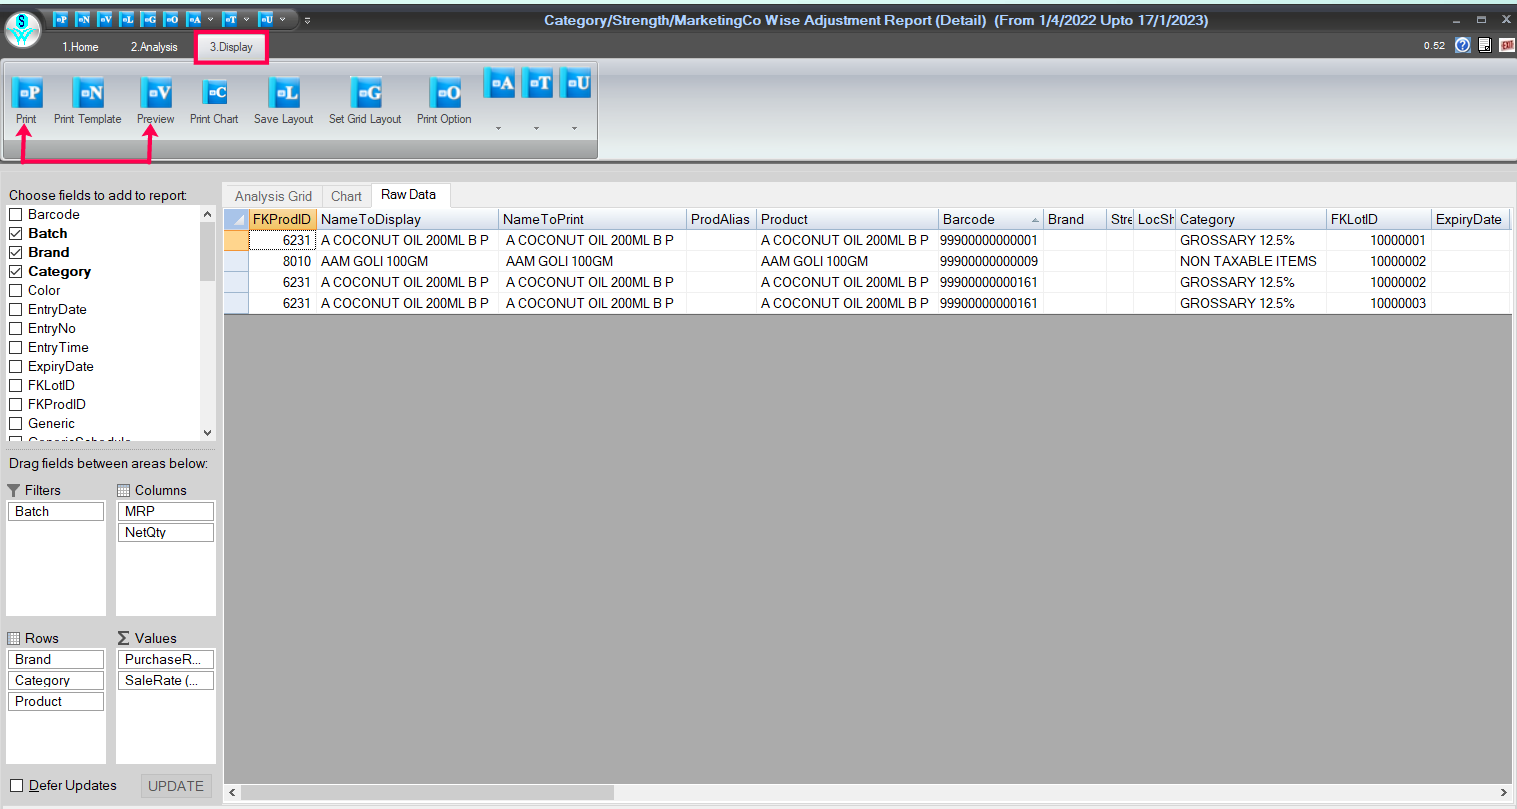
Print & Preview Tab Window
How to export the details in Excel format:
- From the Display tab.
- To export the report, click on the 'T' point.
- Inside the 'T' point, there are given many export formats to choose from in which you want to export.
Reference window: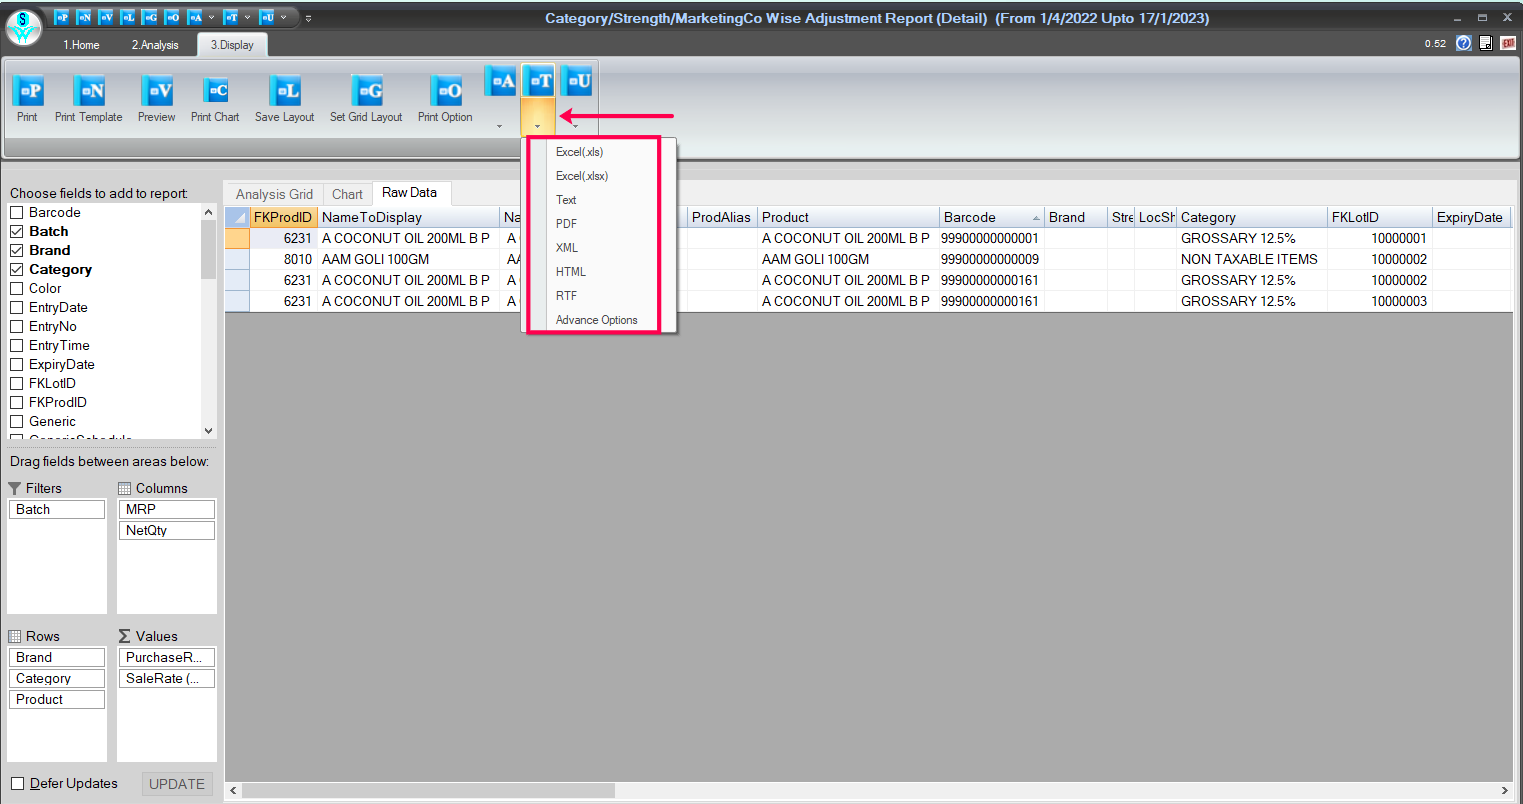
Export Tab Window

|


|
Related Articles
View Sales And Stock (Inventory) Report
How to View the Sales and Stock Report in SwilERP Reporting and analysis are essential to any business because they tell you exactly what's happening in your sales and stock. This report provides the performance of various sales activities and stock ...View Stock Detail Report
How to view the Stock Detail Report in SwilERP The stock report help in managing stock and tracking records of stock. It also assists in finding the purchase and sales numbers. A stock report is a detail of a vendor's existing stock. In the stock ...View Current Stock Profits Report
How to View the Current Stock Report in SwilERP Current stock means goods already on hand at the seller's premises at the purchase order time. In the Current Stock report, the product's category will be available. In the current stock profits report, ...View Negative Stock Report
How to view the Negative Stock report in SwilERP (RetailGraph) This Negative Stock report displays a list of all stock items that have a negative quantity balance. SwilERP software has a feature to view the Negative stock report. In this article, we ...Reconcile Current Stock in SwilERP (RetailGraph)
How to Reconcile Current Inventory with Surplus, Excess, or Shortage in SwilERP Overview of Reconcile Current Inventory: To reconcile current stock with a surplus or shortage, you need to compare the actual stock level with the desired stock level. ...