View Sales Challan Status
How to View the Sales Challan Status Report in SwilERP
A Sales Challan is a document that signifies an agreement to sell goods, where the ownership of the goods does not transfer to the buyer until an official invoice is generated. The customer only takes possession of the goods, not ownership.
In SwilERP, you can easily create a Sales Challan using the built-in feature. This is useful for tracking goods delivered to customers before the final billing.
👉 Learn how to create a Sales Challan in SwilERP:
How to create a Sales Challan and convert it into a Sales Bill.
How to create a Sales Challan and convert it into a Sales Bill.
What is the use of the Sales Challan Status Report?
In the sales challan report, all the sales challans maintained by the vendor can be seen in detail. In this report, details will be available of customer name, amount, status, entry date, etc.
Start with Login in the SwilERP dashboard to initiate the process:
- Go to the Reports menu.
- Select the Transaction Status Report > Sales Challan Status.
Reference Window: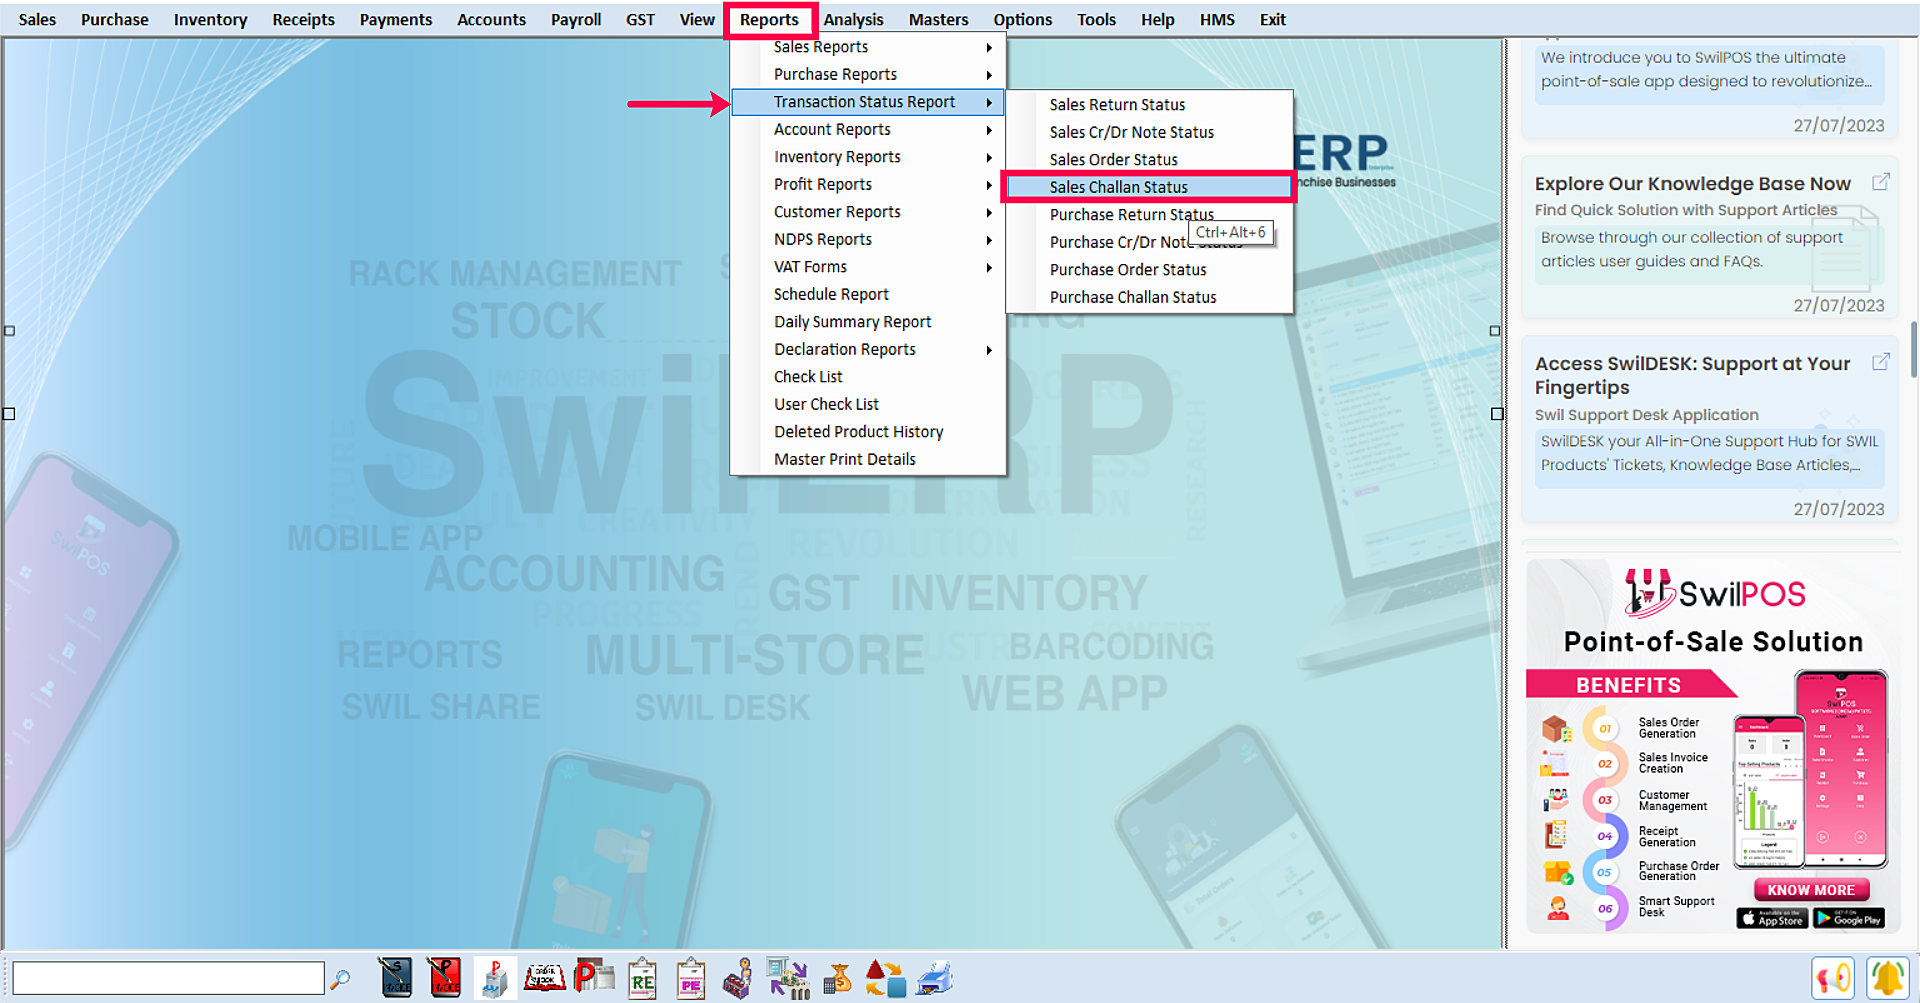
SwilERP Dashboard Window
How to set the parameters to view the Report:
- Go to the Home tab.
- Select the Date Range 'From to To.'
- Select the report Type from the drop-down.
- Choose any option in All / Adjusted and Pending, and a report will show accordingly.
- You can use apply a filter in a Customer tab if required.
- If required, select the Series list.
- Now click on the View tab.
Reference Window: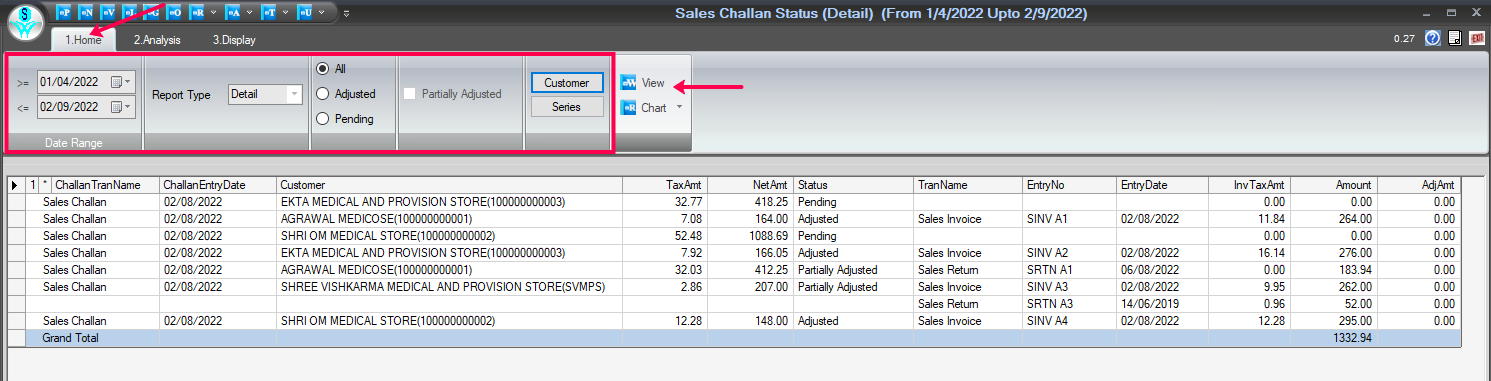
Report Window
How to convert data into Chart form:
- From the Home Tab.
- To convert into a chart, click on the Chart tab and select the chart format in which you want to convert.
Reference Window:
How to analyze the data:
- Firstly, go to the Analysis tab.
- The second step is to click on the View tab.
- Use the field list to arrange fields in a Pivot Table.
- After choosing fields, you will see the data in Analysis Grid.
- Enter the name and click on the Save tab to save this report.
- If you want to open the previous report, enter that report name and click on the Open tab.
- Users can Remove/Export, and Import the report as their requirement.
- You can set Grid as per the requirement.
How to use the Areas Section:
- Use the areas section (at the bottom) of the field list to rearrange fields the way you want by dragging them between the four areas.
- Fields that you place in different areas are shown in the PivotTable as follows:
1. Filters
2. Columns
3. Rows
4. Values
Reference Window: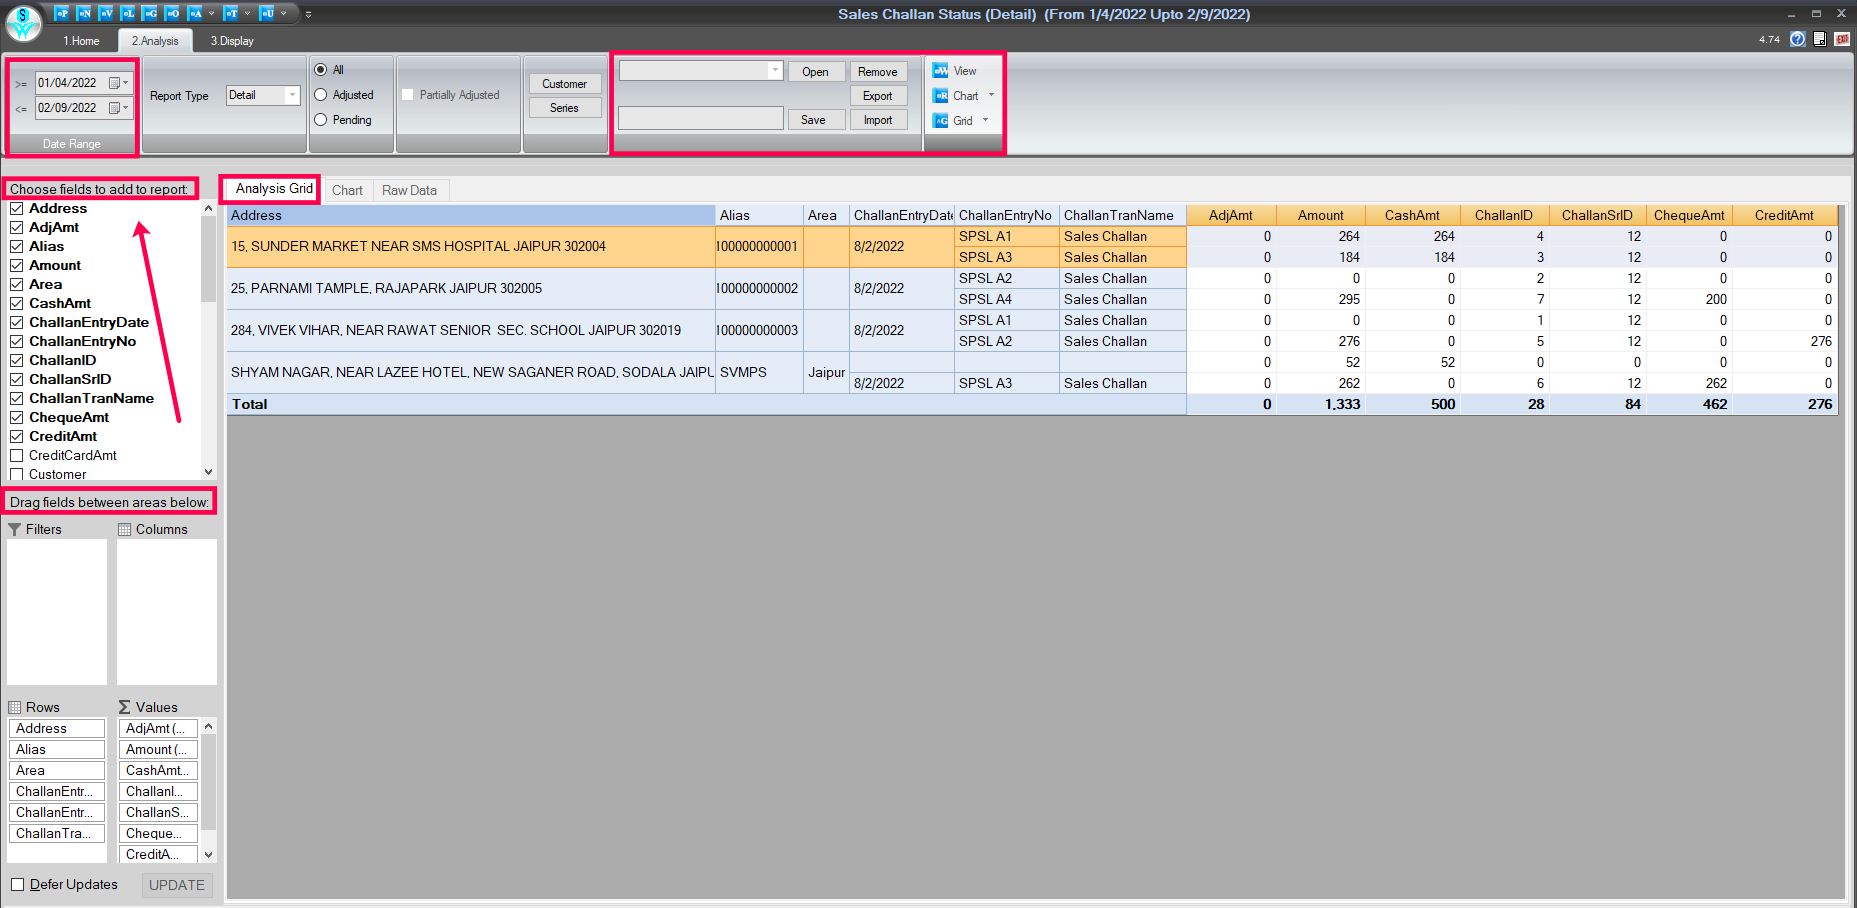
Analysis Tab Window
How to view and analyze data in chart form:
- In the Analysis tab.
- Select the Chart section, and you will see the data in chart form.
Reference Window: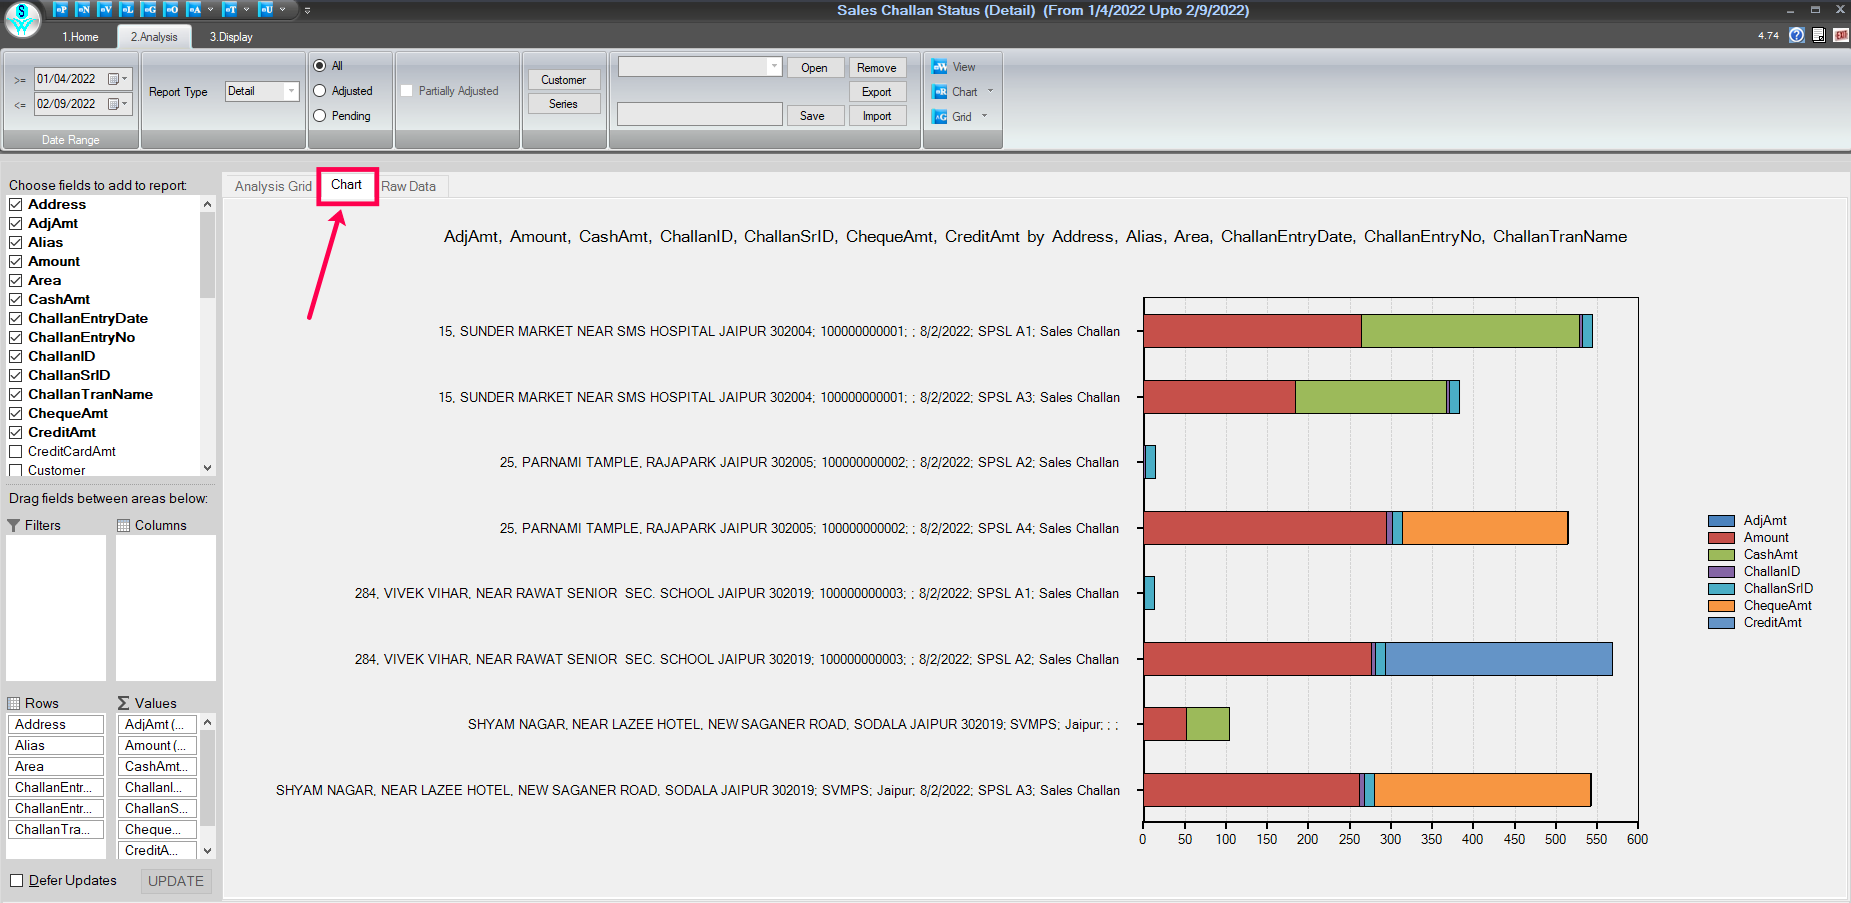
Chart Window
How to view and analyze Raw data:
- In the Analysis tab.
- Select the given Raw Data option to view the Analyze raw data.
Reference Window: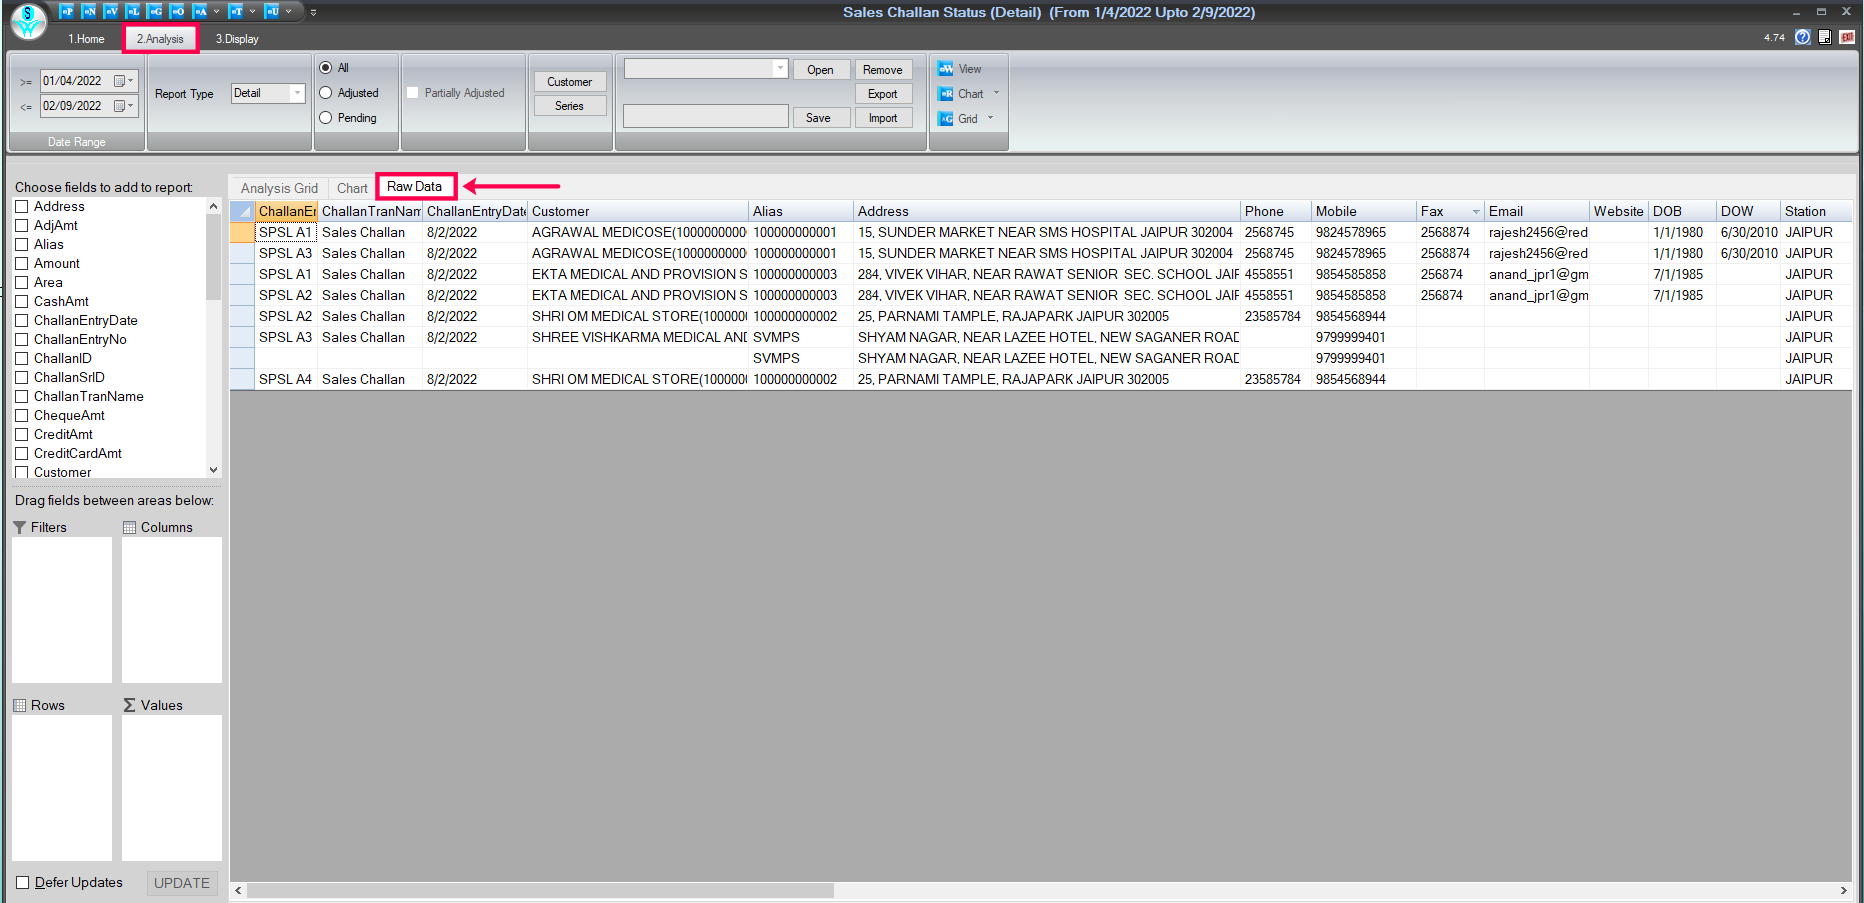
Raw Data Window
How to Print/Preview, and export data:
- Go to the Display tab.
- If you want to take a printout of this report, click on the Print & Preview tab.
- To export the data into excel and other formats, click on the 'T' point.
- Inside the 'T' point are many export options; select where you want to export the data.
Reference Window: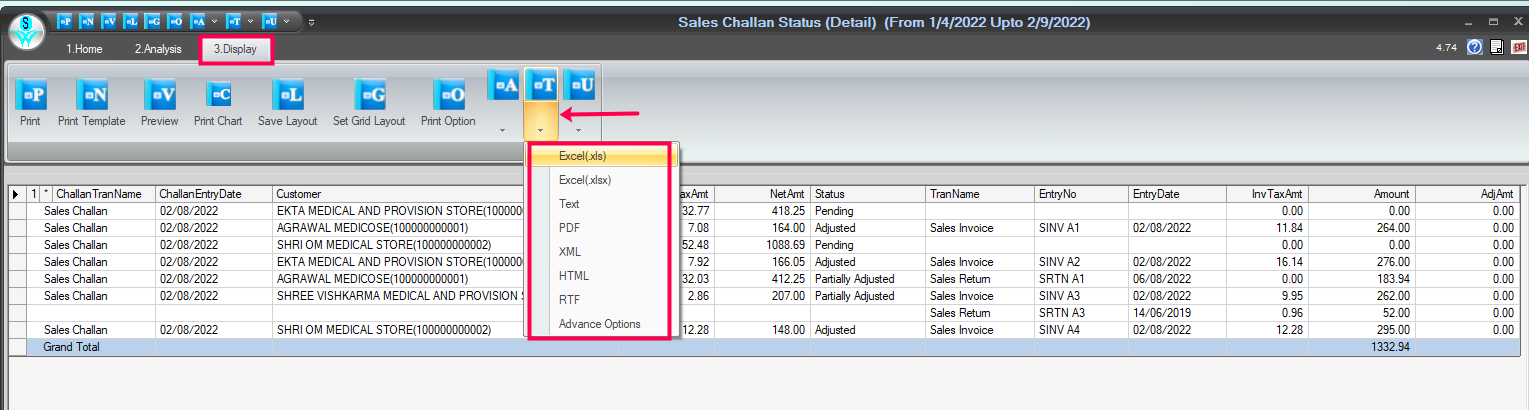
Print/Preview And Export Tab Window