Group Wise Stock Valuation Report
How to View the Group-Wise Stock Valuation Report in SwilERP
Stock valuation determines a stock's current worth at a given period. After doing Stock Valuation, users can generate the Group Wise Stock valuation Report. This report provides you products' Group wise categories details and their stock locations.
In SwilERP Software, the users can easily view the stock valuation on a different basis, i.e. Tax wise, Group wise, Product wise etc. This article will discuss the group-wise stock valuation report from the Reports section. To view Tax wise stock valuation, the user will follow the below steps:
Important Note:
Before generating the Group-Wise Stock Valuation Report, users must first create data using the "Calculate Stock Value" window. Only after this step will the relevant data appear in the report.
👉 To learn how to create data for stock valuation, refer to the article below:
Reference Article: How to Create Data in Calculate Stock Value
Reference Article: How to Create Data in Calculate Stock Value
Start with Login in the SwilERP dashboard to initiate the process:
- Go to the Reports > Inventory Reports
- Select Stock Valuation Reports > Group Wise.
Reference Window: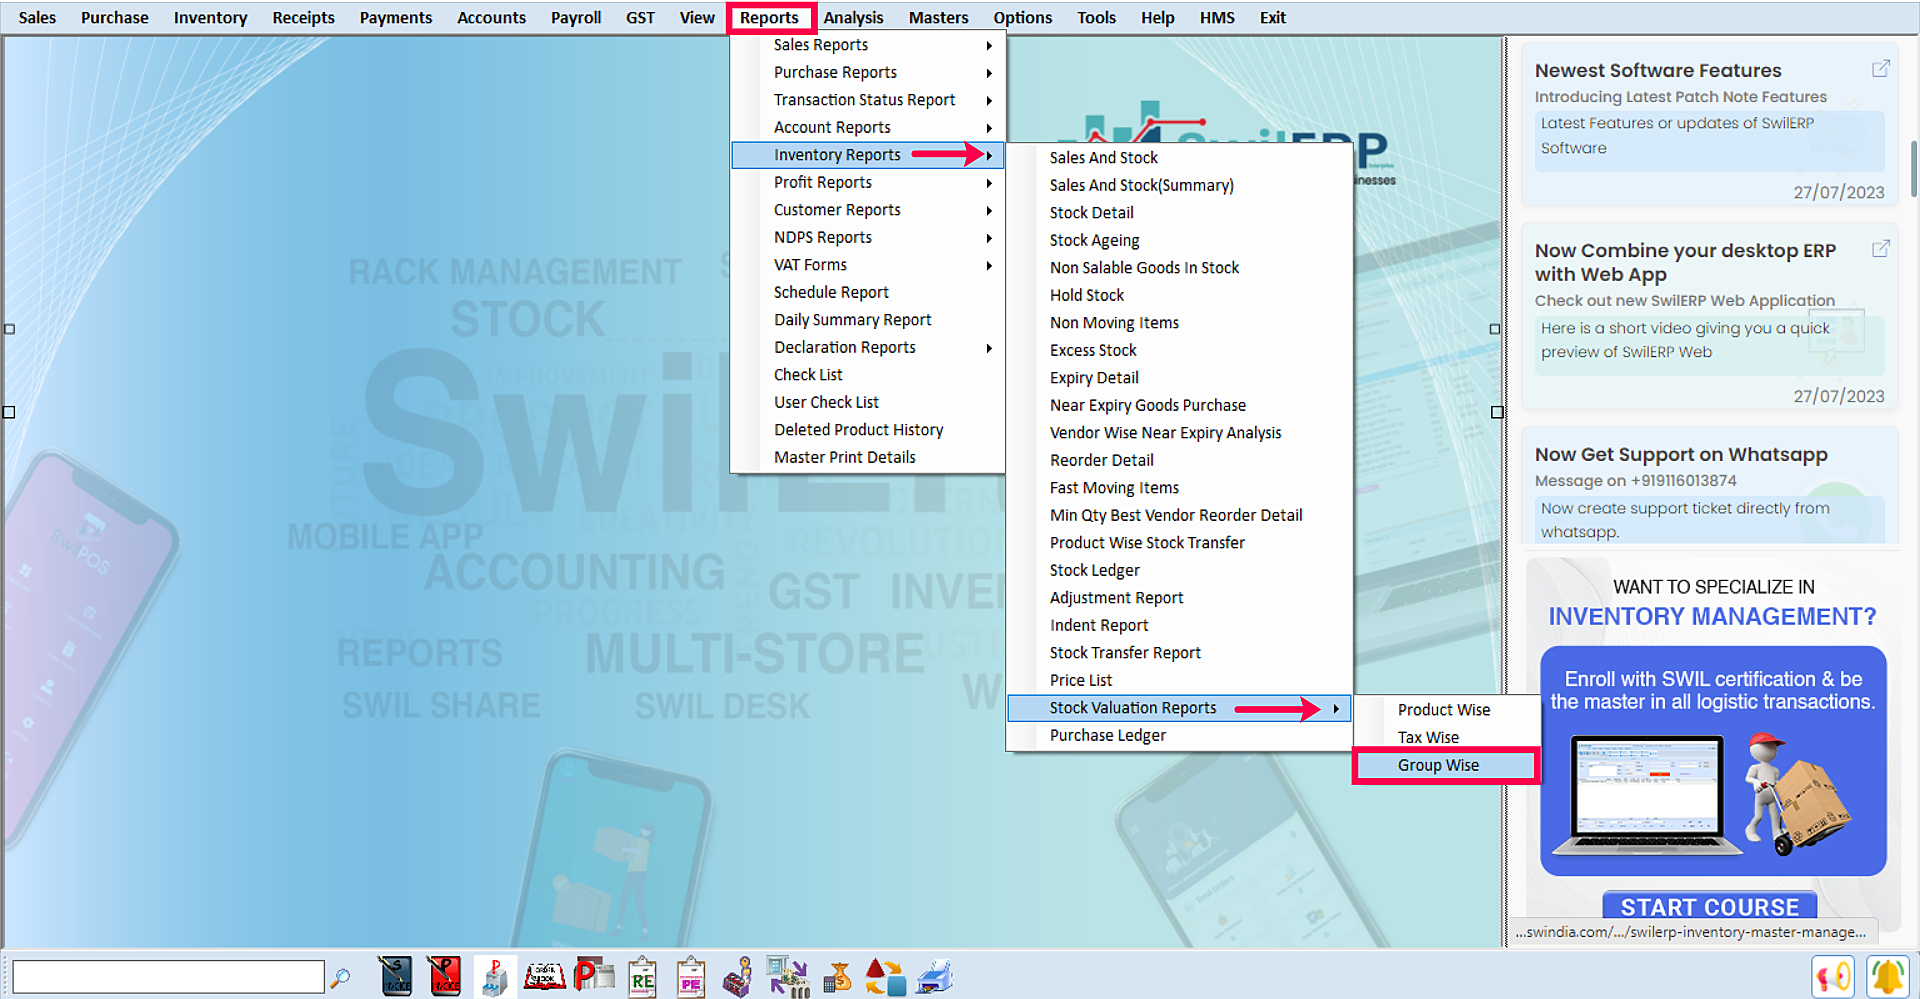
SwilERP Dashboard Window
How to view the details in the report:
- Go to the Home tab.
- In the Report Type given options of summary and details, select in which you want to view details.
Enter the Entry Number which was generated while saving the stock valuation window.
Click on the View option.
Reference Window:-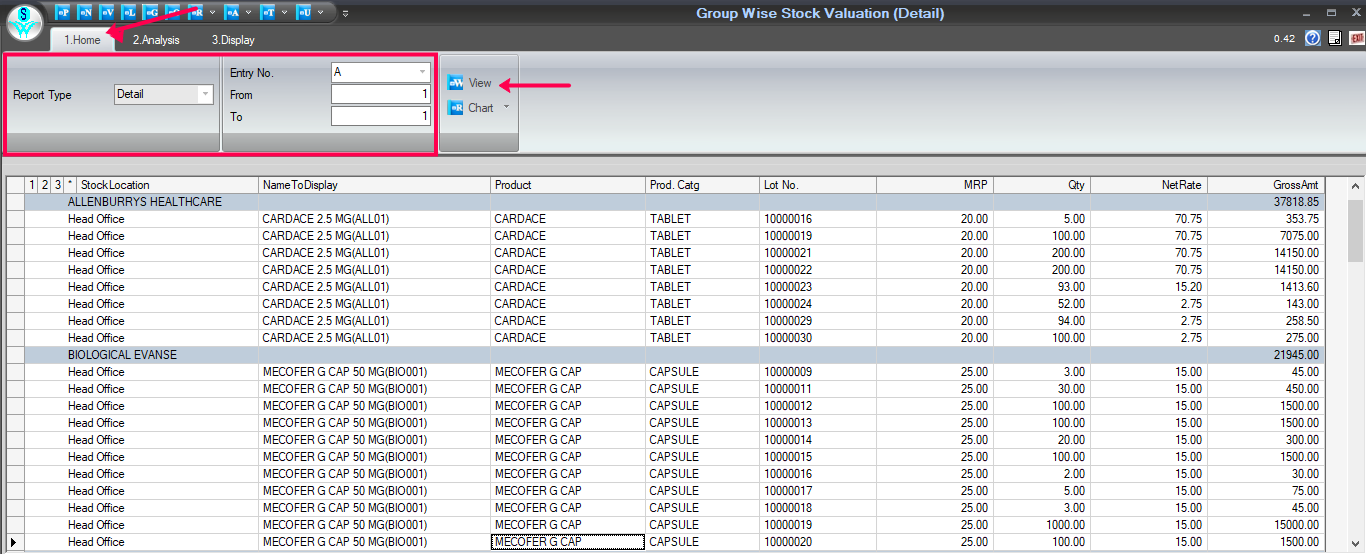
Group-Wise Report Window
How to convert details into the Chart tab:
- From the selected Home tab.
- Click on the given Chart tab and select the chart format in which you want to convert your report.
Reference Window: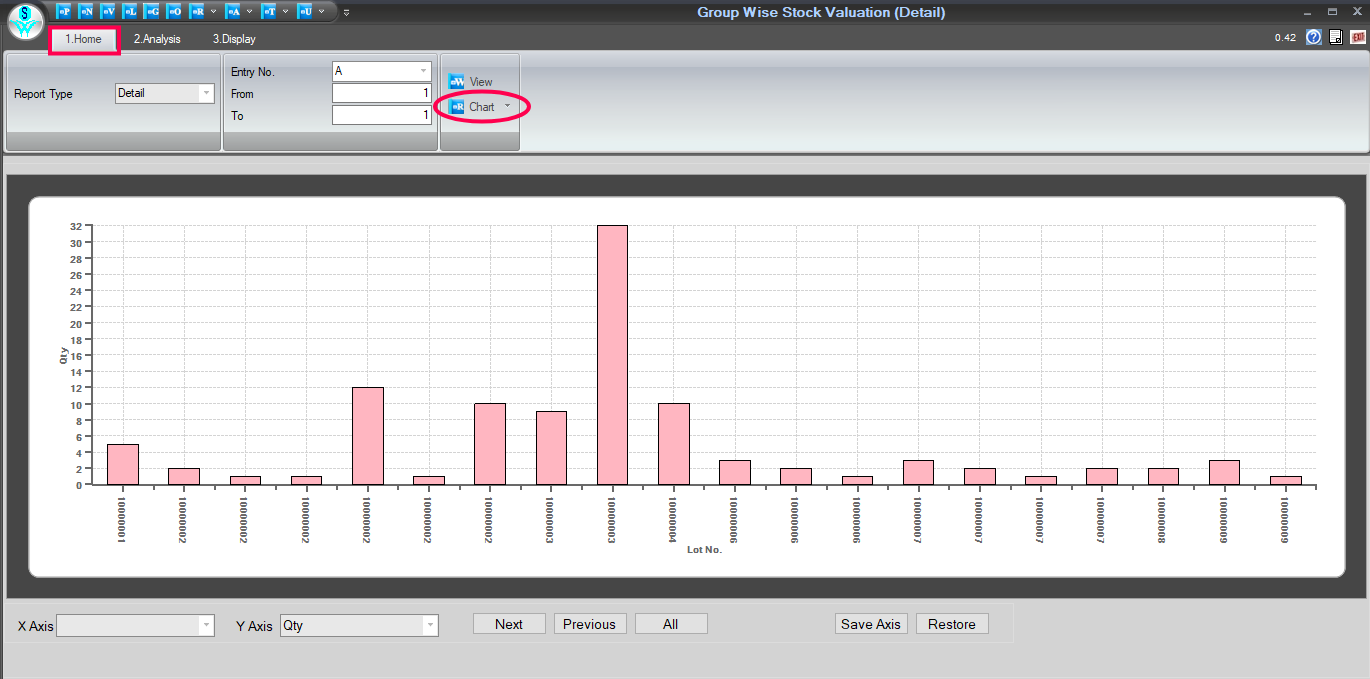
Chart Tab Window
A Step-by-Step Guide to the Data Analysis Process:
- Go to the Analysis tab.
- Select the Report Type as you want.
- Click on the View tab.
- Use the field list to arrange fields in a Pivot Table.
- After choosing fields, you will see the data in Analysis Grid.
- Enter the name and click on the Save tab to save this Report.
- If you want to open the previous Report, enter that report name and click on the Open tab.
- Users can Remove/Export, and Import the Report as their requirement.
- You can set Grid as per the requirement.
How to use the Areas Section:
- Use the areas section (at the bottom) of the field list to rearrange fields the way you want by dragging them between the four areas.
- Fields that you place in different areas are shown in the PivotTable as follows:
1. Filters
2. Columns
3. Rows
4. Values
Reference Window: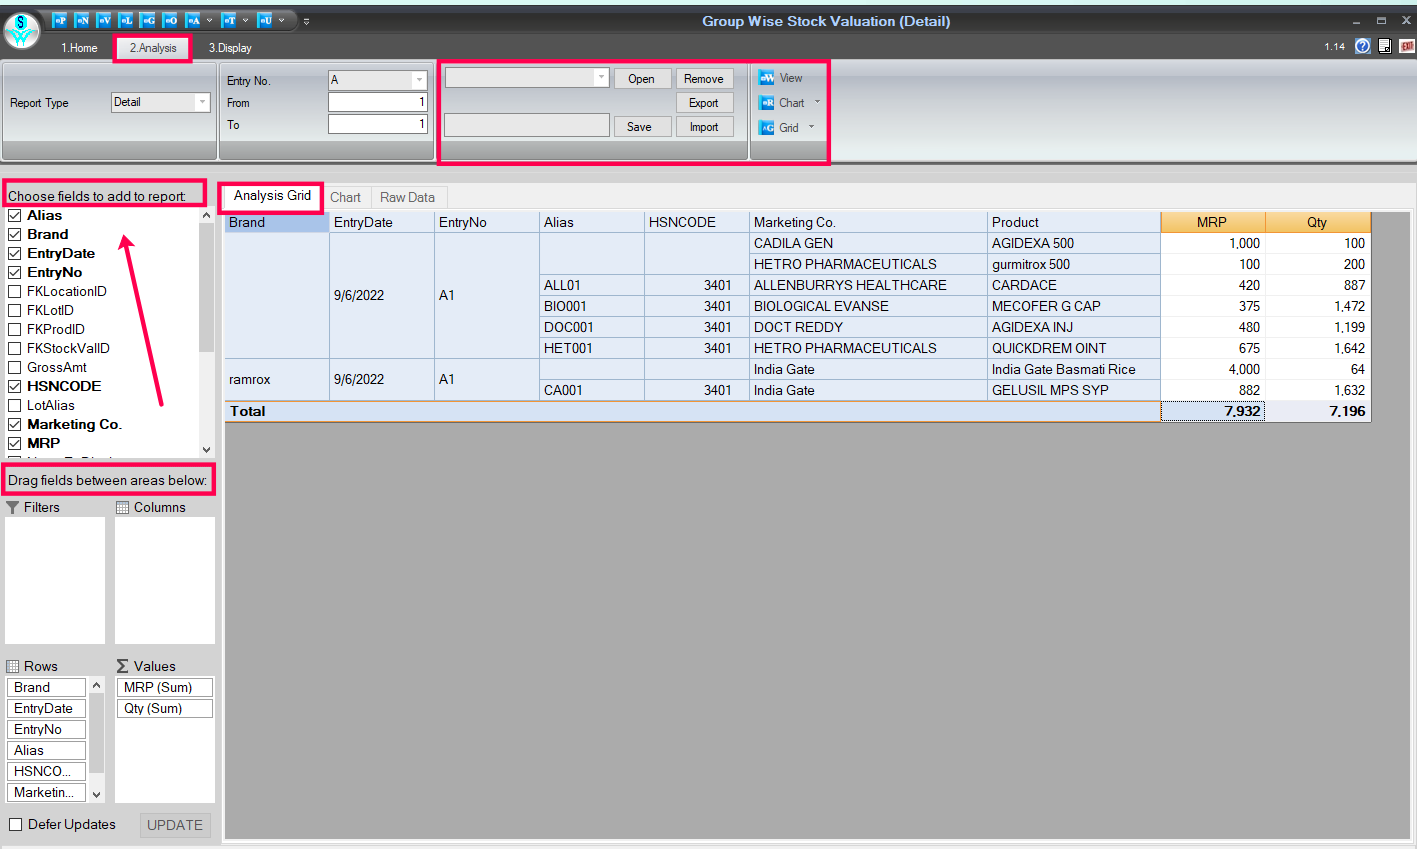
Analysis Tab Window
How to view the Analyzed data in the chart form:
- In the selected Analysis tab.
- Select the Chart section, and you will see the data in chart form.
Reference Window: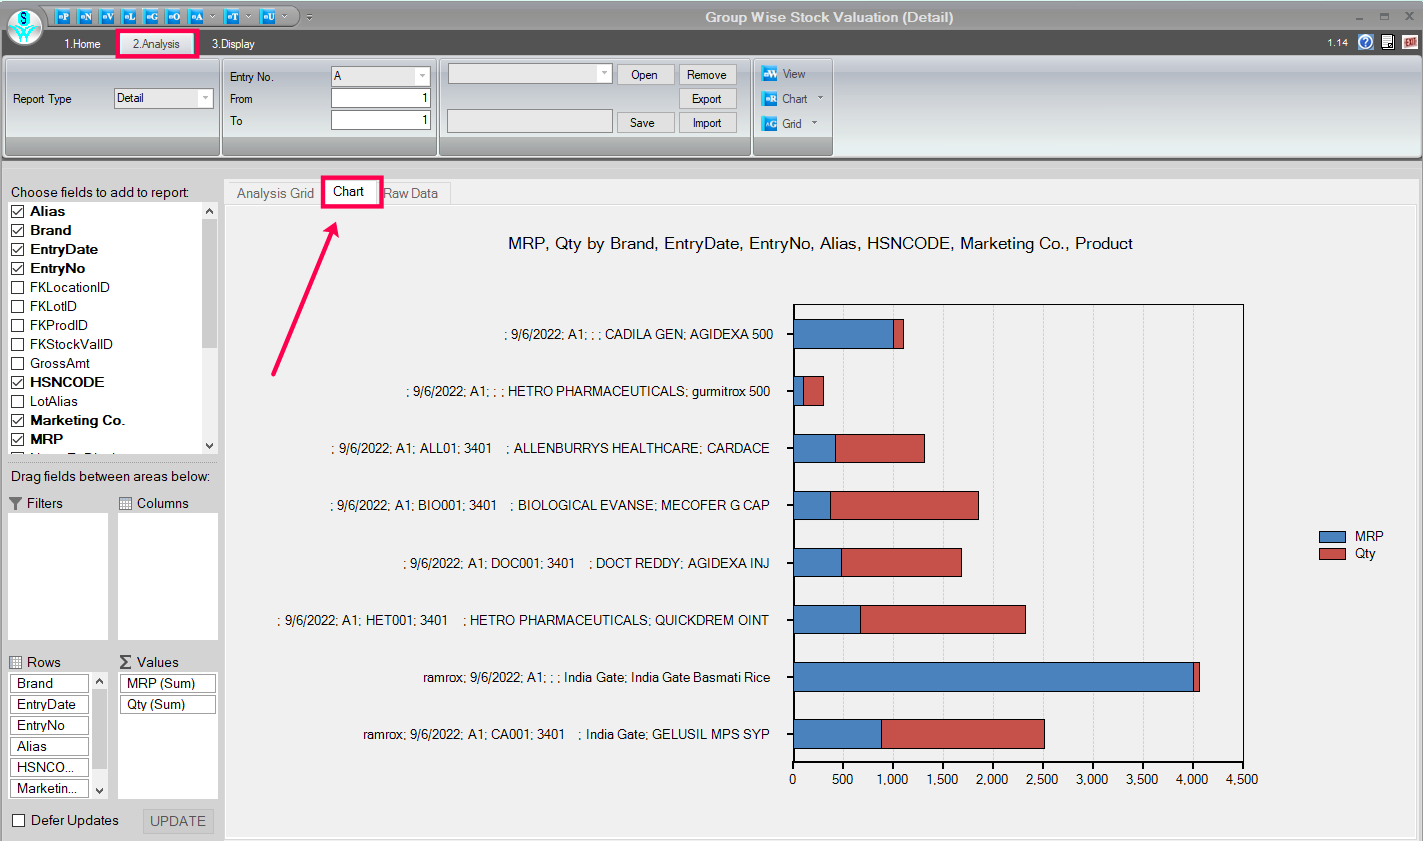
Chart Tab Window
How to view Raw Data for analyzing details:
- Click on the given 'Raw Data' option to view the raw data.
Reference Window: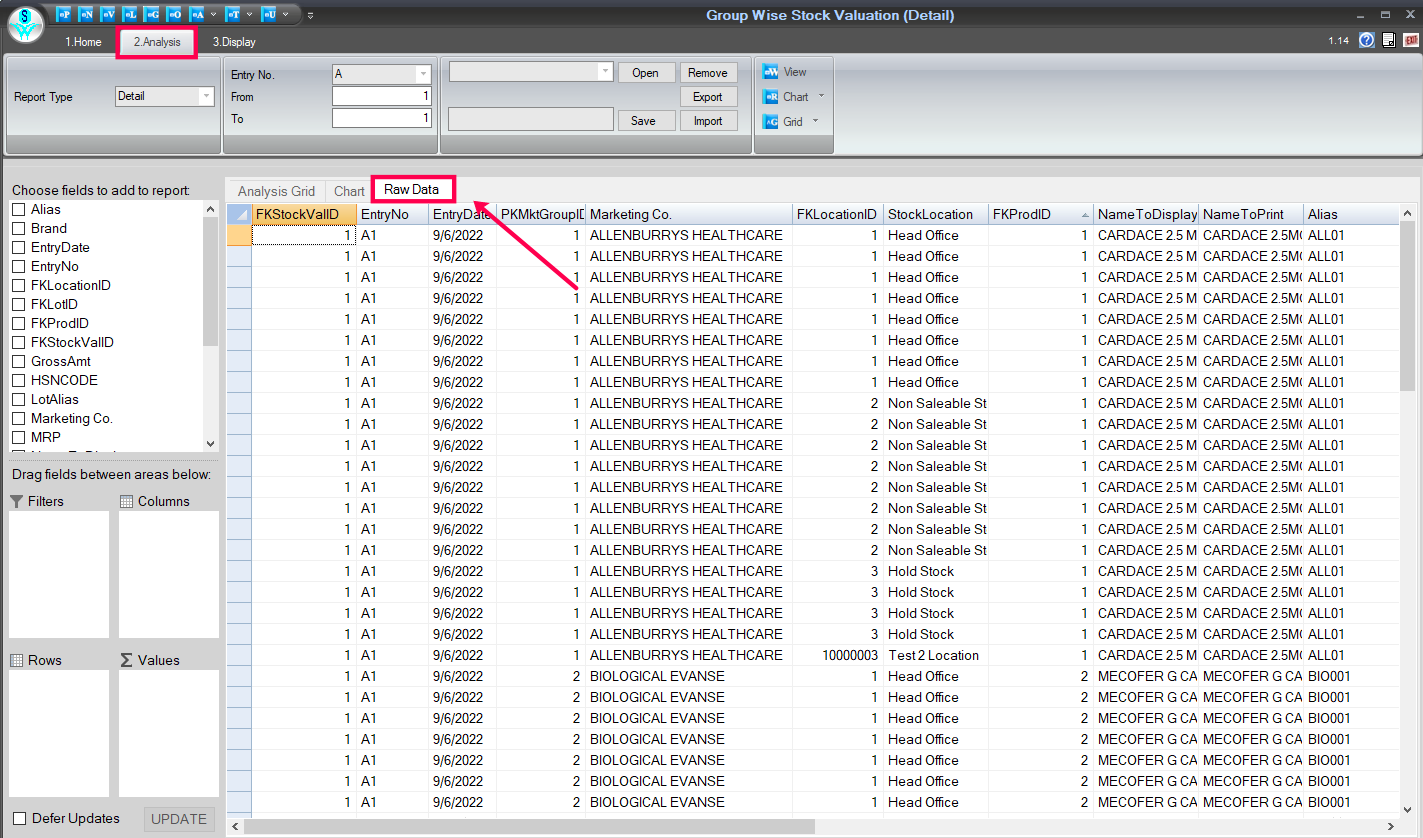
Raw Data Window
How to Print/Preview and export the details:
- Click on the 'T' point to export the details.
- Inside the 'T' point, given many options for export formats, choose as per the requirement.
Reference Window: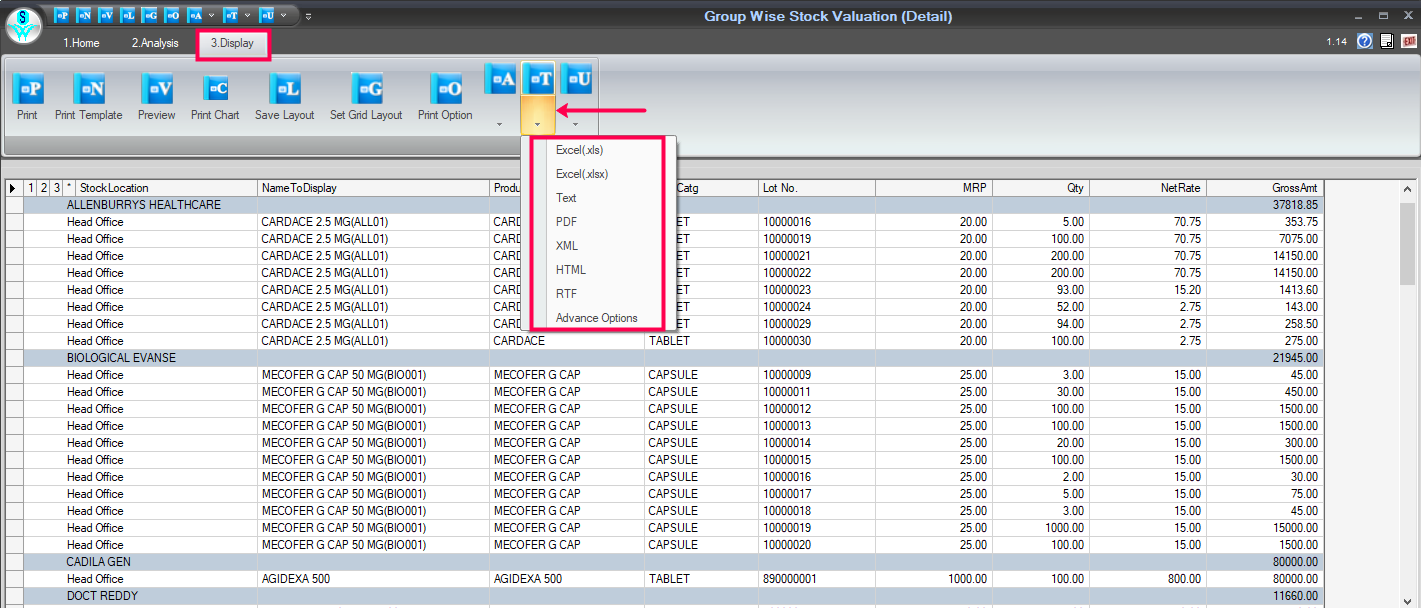
Print/Preview & Export Window

|


|
Related Articles
Tax Wise Stock Valuation Report
How to View the Tax-Wise Stock Valuation Report in SwilERP Stock valuation determines a stock's current worth at a given period. After doing Stock Valuation, users can generate the Tax Wise Stock Report. This report shows every detail, such as the ...Process to Email Stock Valuation Report
How to Email Stock Valuation Report in SwilERP The stock valuation report in SwilERP software helps manage inventory data and assess stock value in terms of overvaluation, undervaluation, or market price. Users can access this report under the ...Calculate Stock/Inventory Value
How to Calculate Stock Value in SwilERP (RetailGraph) Software What do you mean by Stock/Inventory valuation? The process of calculating the value of goods or materials owned by a company or available for sale in a store at a particular time or the ...Product Wise Stock Valuation Report
How to view the Product Wise Stock Valuation Report in SwilERP What is the meaning of Stock valuation? Stock valuation determines a stock's current worth at a given period. After doing Stock Valuation, users can generate the Product Wise Stock Report ...View Sales And Stock (Inventory) Report
How to View the Sales and Stock Report in SwilERP Reporting and analysis are essential to any business because they tell you exactly what's happening in your sales and stock. This report provides the performance of various sales activities and stock ...