Product Wise Stock Valuation Report
How to view the Product Wise Stock Valuation Report in SwilERP
What is the meaning of Stock valuation?
Stock valuation determines a stock's current worth at a given period. After doing Stock Valuation, users can generate the Product Wise Stock Report from the Reports section. This report shows every detail, such as the product's name, product Lot Number, MRP, Batch, Expiry Date, Stock Location, Qty, Net Rate, and Gross Amount.
Why is Stock Valuation Important?
Stock valuation is essential in many ways; one is that it is used to identify whether a stock is overvalued, undervalued, or at market price.
Here are the steps to view the product-wise report in SwilERP:-
Start with SwilERP Dashboard to initiate the process:
- Go to the Reports > Inventory Reports
- Select Stock Valuation Reports > Product Wise.
Reference Window: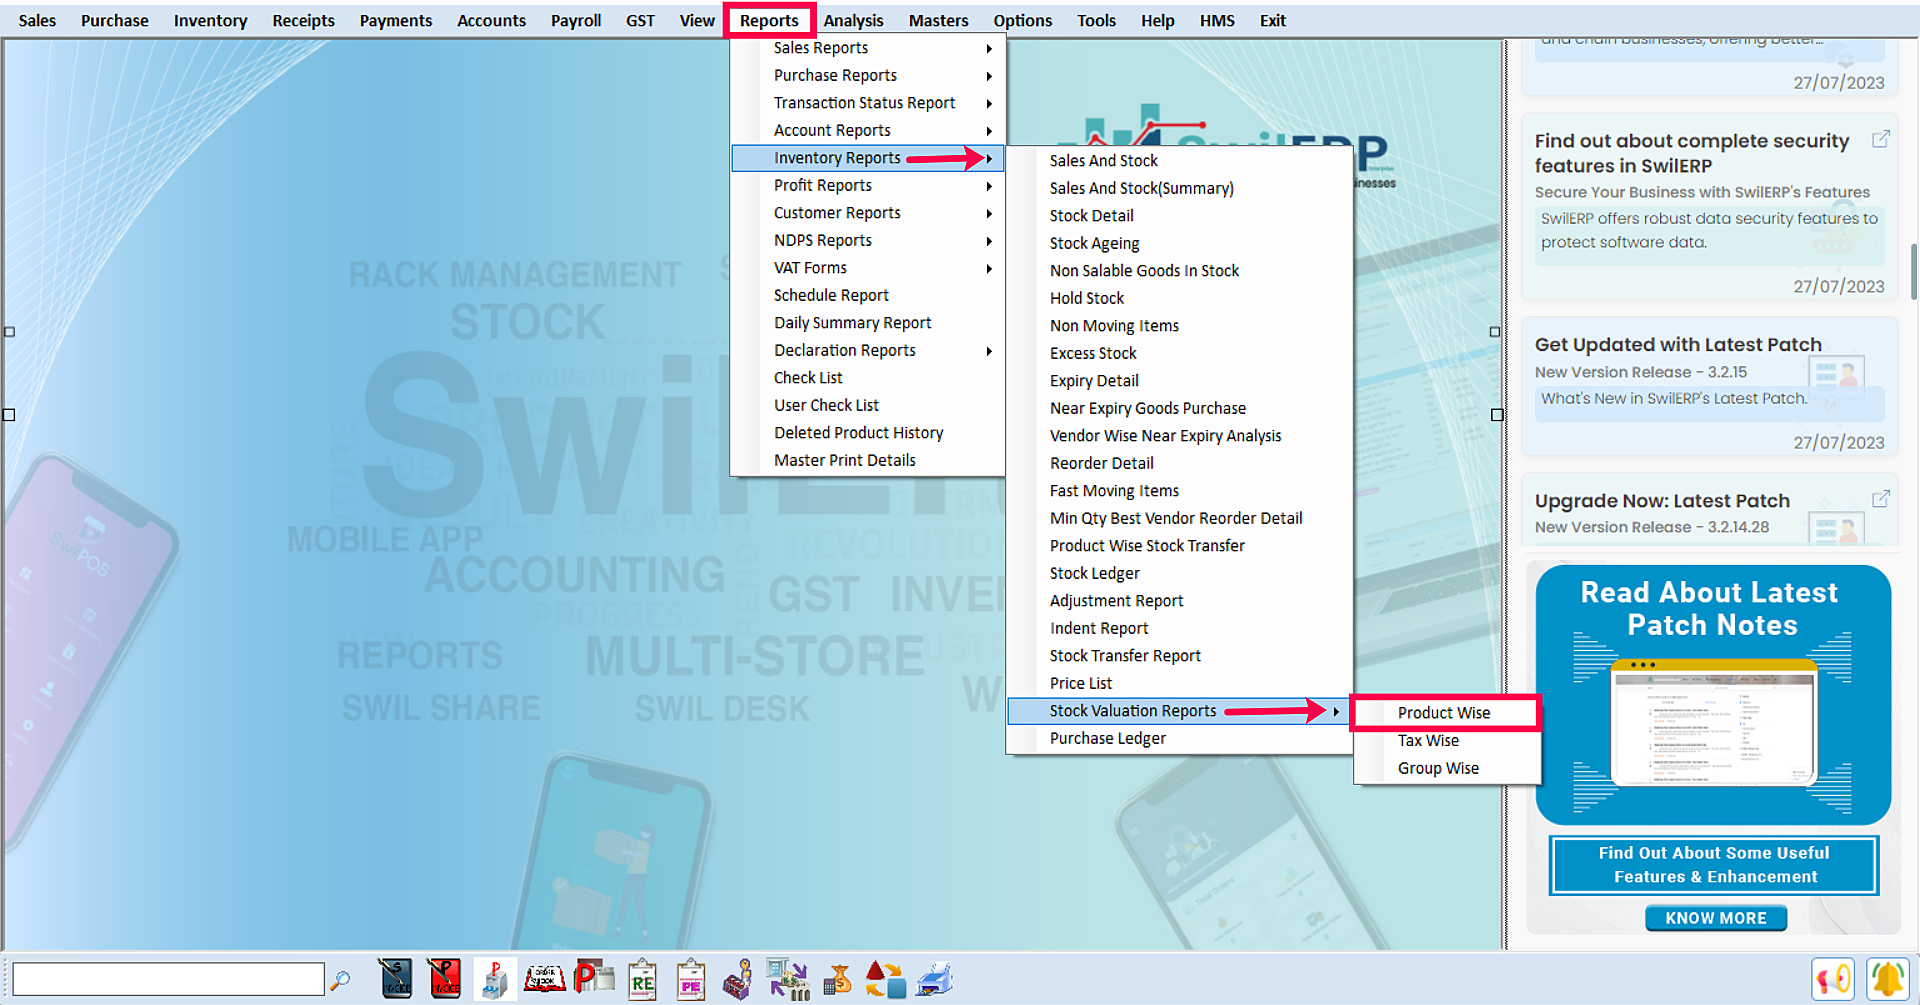
SwilERP Dashboard Window
How to view the report:
- Go to the Home tab.
- Select the Report Type such as Summary/Detail.
- Enter the Entry Number which was generated while saving the stock valuation window.
- Click on the View option.
Reference Window: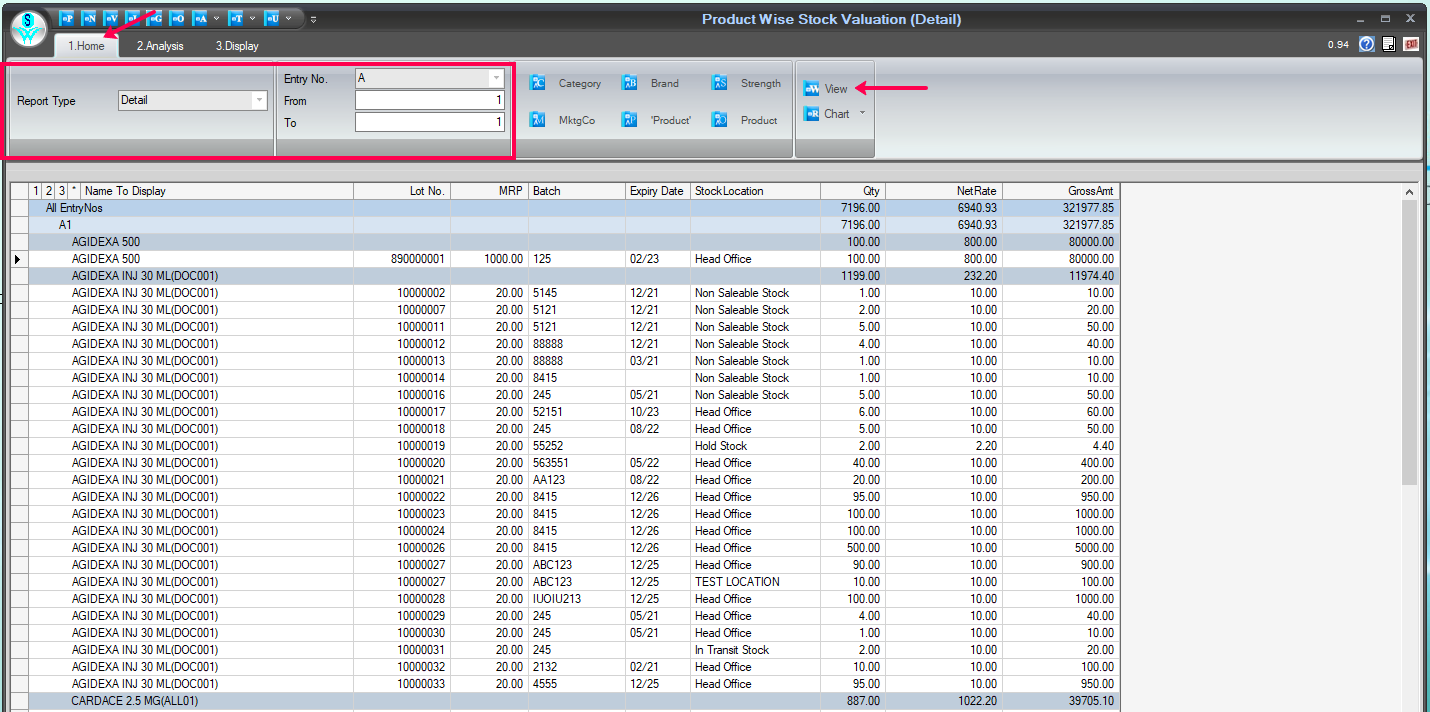
Report Window
There is a more option to view the report:
- In the selected Home Section.
- Select Category, Brand, Strength, Generic, MktgCo., and Product to view the detail in these options.
- Click on the View option.
Reference Window: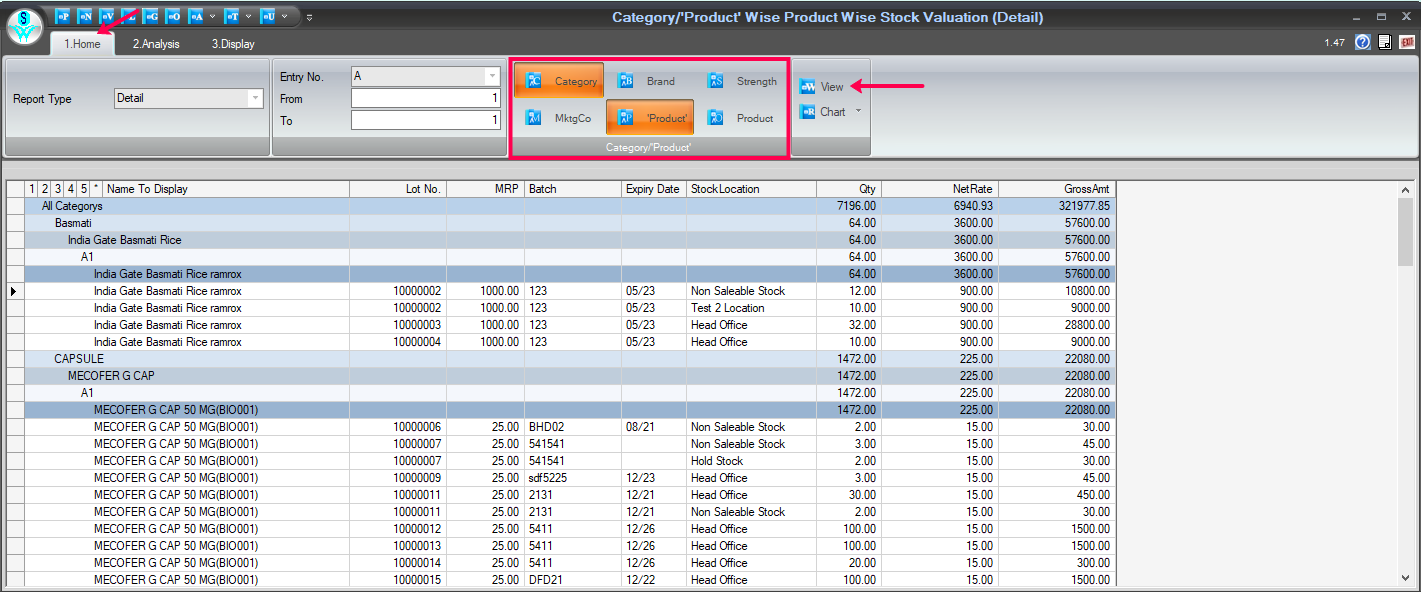
Report Window
How to convert data into Chart form:
- In the selected Home tab.
- To convert data into chart form, click on the Chart tab and choose in which you want to convert.
Reference Window: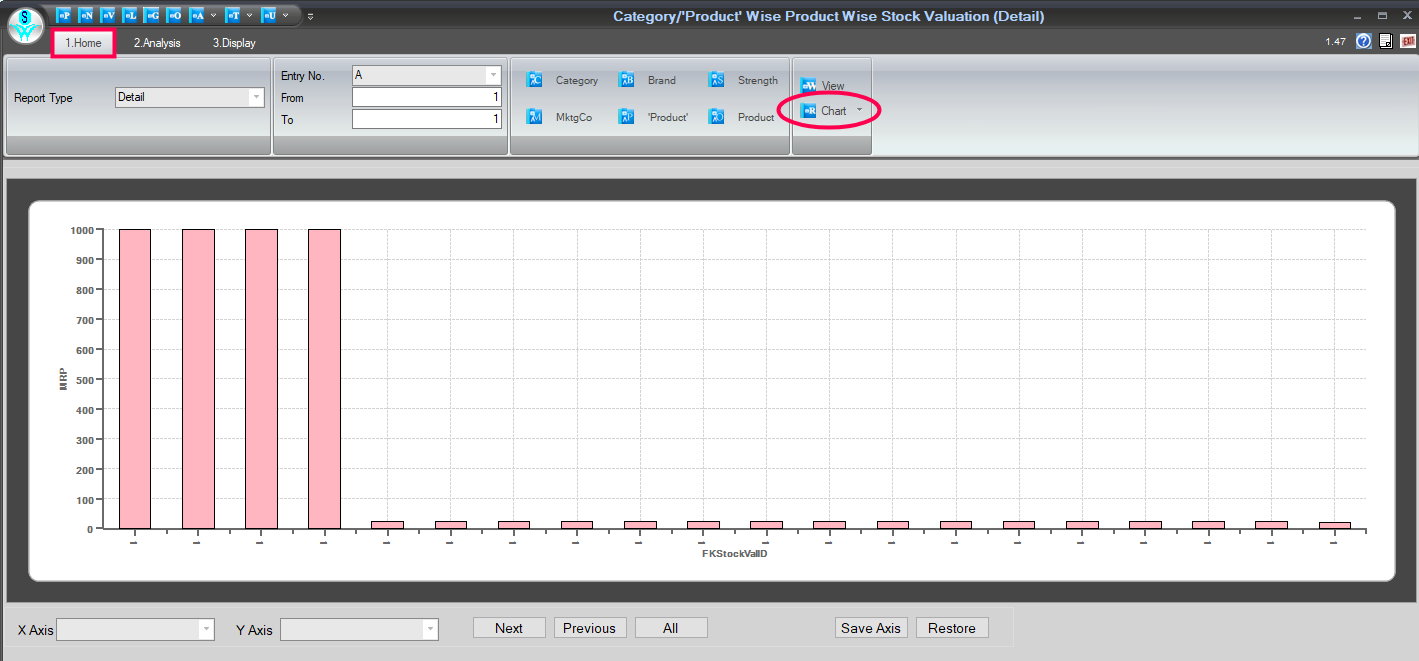
Chart Tab Window
How to analyze the data:
- Firstly, go to the Analysis tab.
- The second step is to click on the View tab.
- Use the field list to arrange fields in a Pivot Table.
- After choosing fields, you will see the data in Analysis Grid.
- Enter the name and click on the Save tab to save this Report.
- If you want to open the previous Report, enter that report name and click on the Open tab.
- Users can Remove/Export, and Import the Report as their requirement.
- You can set Grid as per the requirement.
How to use the Areas Section:
- Use the areas section (at the bottom) of the field list to rearrange fields the way you want by dragging them between the four areas.
- Fields that you place in different areas are shown in the PivotTable as follows:
1. Filters
2. Columns
3. Rows
4. Values
Reference Window: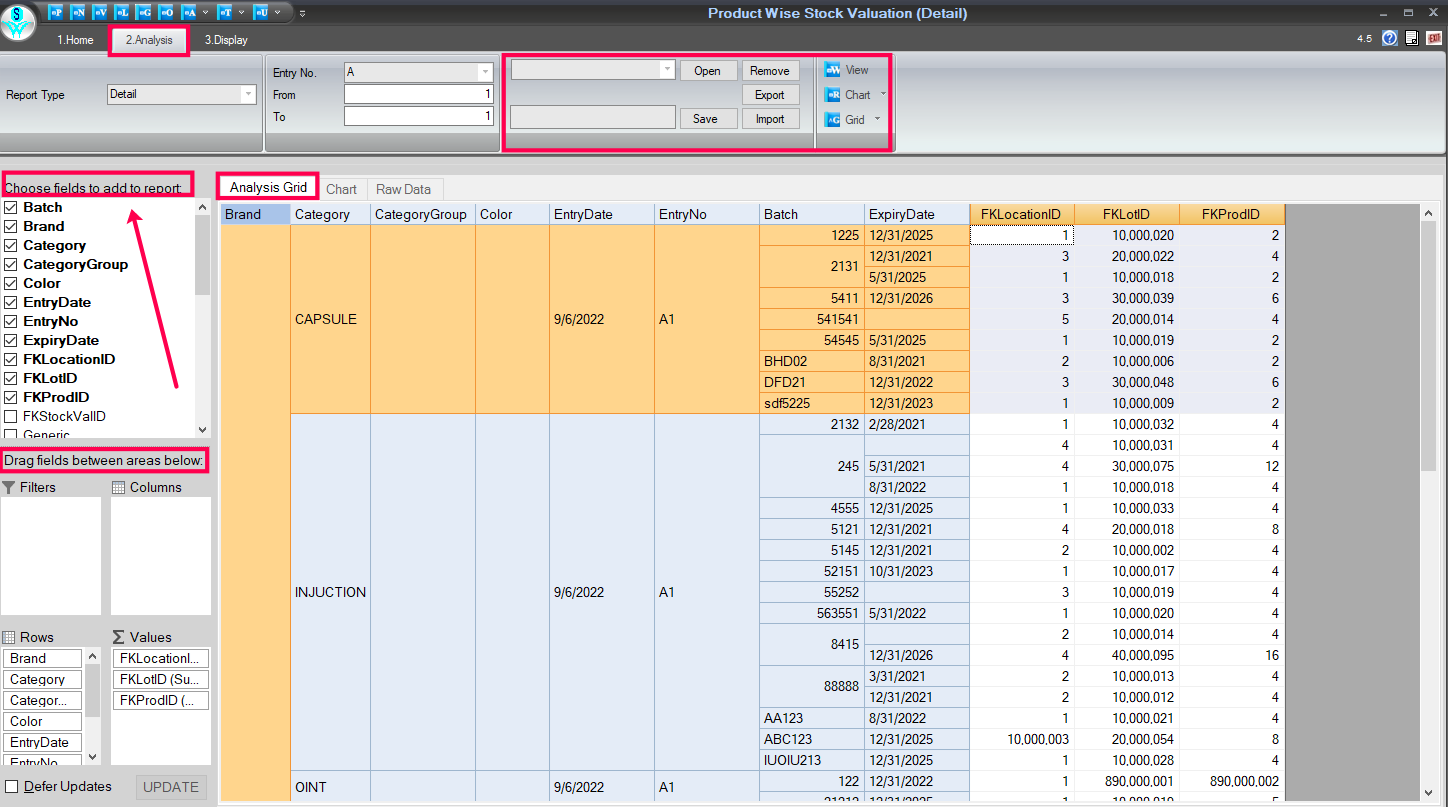
Analysis Tab Window
How to view and analyze data in chart form:
- In the Analysis tab.
- Select the Chart section, and you will see the data in chart form.
Reference Window: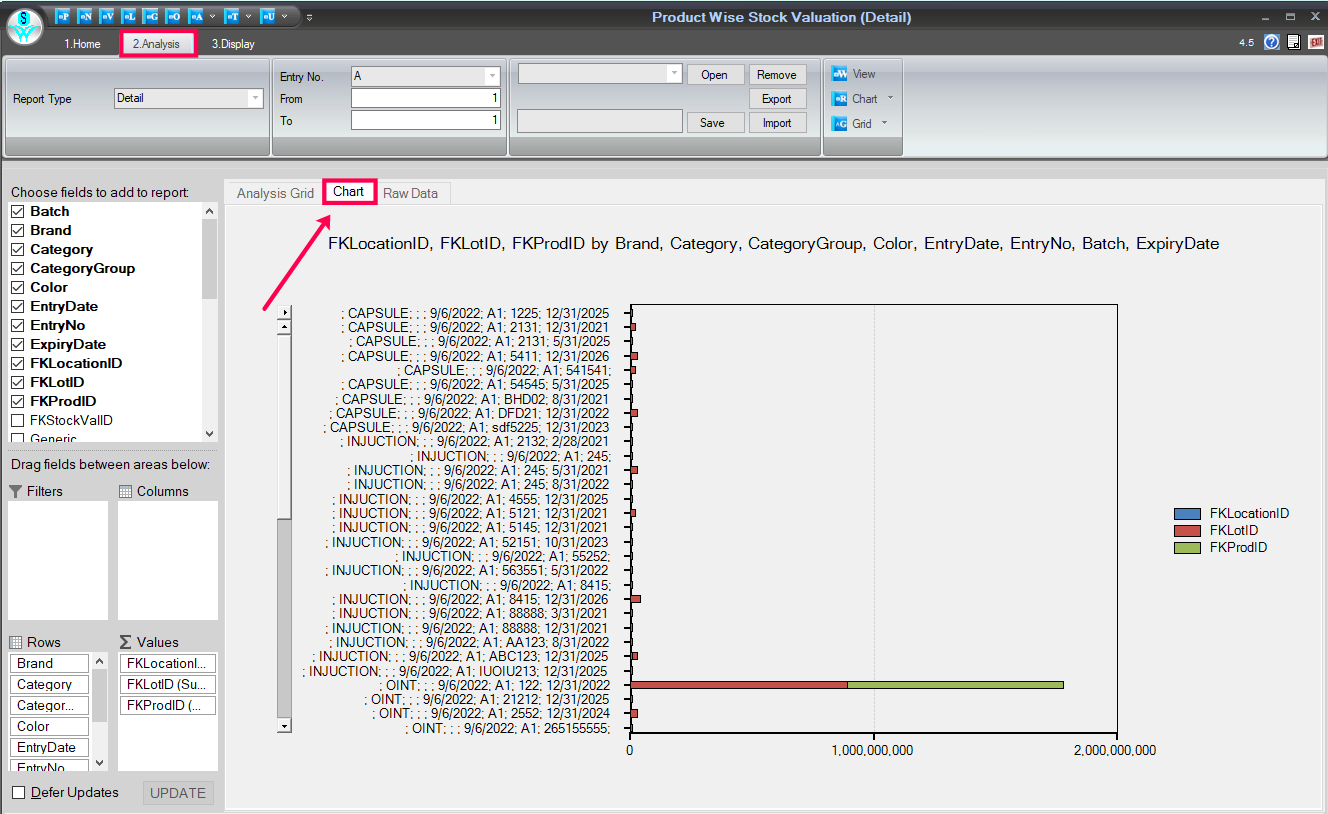
Chart Format Window
How to view Raw data:
- In the selected Analysis tab.
- Select the given Raw Data option to view the analyzed raw data.
Reference Window: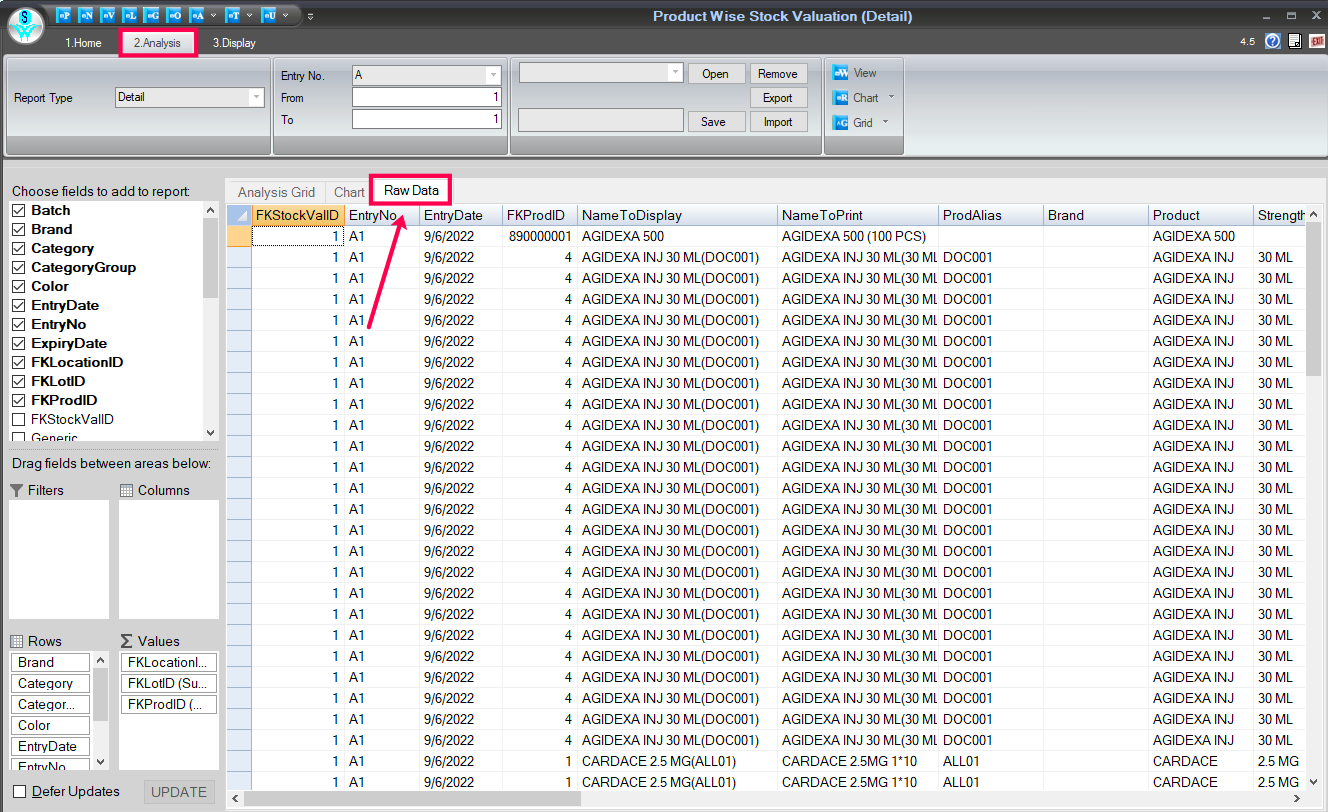
Raw Data Window
How to Print/Preview and export the details:
- Firstly, go to the Display tab.
- To take a printout of this report, click on the Print & Preview Tab.
- Click on the 'T' point to export the details.
- Inside the 'T' point, given many options for export formats, choose as per the requirement.
Reference Window: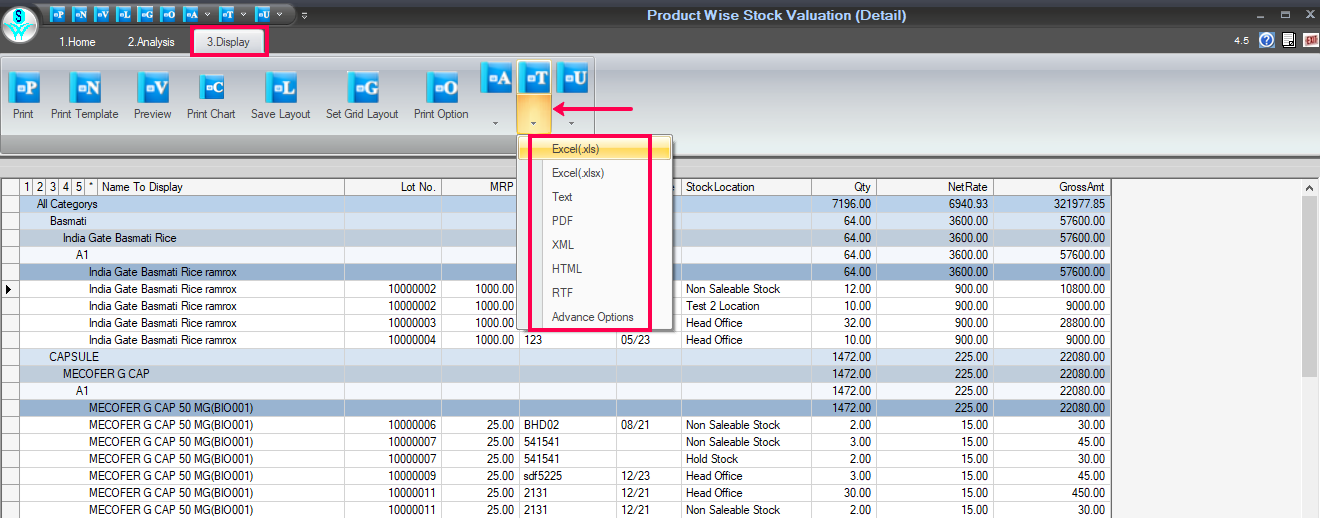
Print/Preview & Export Window